Tagged Interdisciplinary

A diagram showing the development cycle with four components: specification, design, development, and deployment. Each component is further divided into ideate, solidify, and implement. The four components form one iteration of the cycle.
0

Interdisciplinary Approach to a Coping Skills App: A Case Study

Abstract

Rich learning opportunities exist when academic departments reach beyond their discipline. During the COVID-19 pandemic, we organized an interdisciplinary team to create a mobile app to measure and support mental health through better coping skills education in the local community of Erie County, Pennsylvania. Guidance on how to develop a professional level organization at an undergraduate academic institution for app creation is sparse. Best practices in developing this environment are needed. This article describes how we, a team of four educators and three students, created the mobile app. The process mimicked a professional development team with many adjustments. The arrangement of the team and the process taught the students teamwork and gave the educators an opportunity to collect meaningful data on the local population. The methodology included adaptations from industry in a project planning guide, requirements gathering processes, user testing processes, prototyping and iterations. Development encountered several unanticipated challenges with the need for two institutional review board approvals, consultation with an attorney, hosting challenges, and Google Play Store hurdles. We suggest that future academic teams plan for these challenges at the outset. This interdisciplinary experience is a complement to any digitally-oriented classroom and is a nice introduction for students to gain the needed skills to advance to Startup and Tech Accelerator programs already in place at many universities.

Introduction

Rich learning opportunities exist when academic departments reach beyond their discipline and engage with each other. Interdisciplinary approaches are key to success in independent business entities and they allow a team to “engage with their ideas, maintain productive interaction, and successfully implement these ideas” (Brodack and Sinell 2017, 10). Interdisciplinarity broadens the knowledge base of a project team, taking full advantage of the specialized knowledge of its members while avoiding the peripheral blindness often associated with such specialization. When managed correctly, creative problem-solving outcomes are enhanced (Moirano, Sánchez, and Štěpánek 2020), silos are merged, and focus limitations associated with specialization are removed (Blackwell et al. 2009). Working on a project within an academic environment is no different. Students have specialized knowledge and often a preconceived perception of a problem. Collaboration with those outside their field broadens their interpretation of and approach to a problem while allowing them to use their special skills with external input. Developing a mobile app requires the technical skills of computer scientists, the knowledge of subject matter experts, and the expertise of user experience researchers. Here, we present a case study of a successful app development process as a blueprint for others to follow with a discussion of tools, activities, time budgets, resources, challenges, and potential impact.

During the COVID-19 pandemic, two psychology faculty members (a clinical psychologist and an engineering psychologist) and one computer science faculty member collaborated along with the corporate liaison at the university to address the increased need for coping skills in the local and student community (Fernández et al. 2020; Naeem et al. 2020; Saltzman et al. 2020). We received a grant and hired two undergraduate students and one graduate student to work with us. This article documents our wins and lessons learned in order to help other academics bootstrap the process.

Research is clear on the significant negative effects resulting from the COVID-19 Pandemic. In addition to significant physical health risks, there are substantial increases in the rate that individuals are experiencing mental health symptomatology such as distress, anxiety, sadness, and isolation (Kar et al. 2020; Pierce et al. 2020). Unfortunately, there has been less focus placed on increasing our ability to address mental health concerns at a systems level even in the face of rising pathology (Kar et al. 2020).

As a result of the pandemic, there is a shift within the mental health field towards providing more services remotely (e.g., meeting with a therapist by webcam). However, that shift does not address the increasing demand for mental health services. Thus, there is a significant need to develop other digital avenues to try and reach individuals in need (Ho 2020). According to Ho (2020), apps developed for smartphones to provide users with psychoeducation, resources, and coping strategies may prove especially useful to help meet increased mental health needs during the pandemic. Previous research demonstrates the viability of using smartphones to integrate mental health services through technology. Digital apps have been created to monitor, record, and, in some cases, modify mental health, such as providing location-based services to alert users to the nearest mental health clinic, providing self-help mantras and guided meditations, and tracking mood ratings based on self-reporting (Luxton et al. 2011).

According to the Centers for Disease Control and Prevention (2021), engaging in appropriate coping strategies during the pandemic is important to maintaining one’s mental wellbeing. We developed the Serene app to help our students and the surrounding community cope with the pandemic while gathering information on the mental health of the community. Specifically, the app was developed to accomplish this goal through non-medical advice that engages users with behavioral activities, psychoeducation, motivational quotes, video exercises for relaxation and breathing, local and national professional resources, and connections to available, external, evidence-based mental health apps.

We set out to determine the best practices in developing a professional level organization for app creation. We anticipated the project would take four months, but it took eight months with an additional four weeks for the Google Play Store release and an additional eight weeks for media coverage.

Organization

Our group was separated into three pairs, each consisting of a faculty member and a student. Faculty members chose students in their discipline based on previous coursework, previous independent study, and their experience of the students in their courses. The faculty/student pairs are referred to as teams. The three teams were as follows:

  1. UX (user experience) team (an engineering psychology professor and an undergraduate human factors psychology student who successfully completed the assignment in Appendix A),
  2. Content team (a clinical psychology professor and a counseling graduate student), and
  3. App development team (a computer science professor and an undergraduate computer science student).

The corporate liaison provided advice and guided compliance to the institutional mission and the funding agency’s mission.

User experience (UX) team

The UX team organized first to create the design for the minimally viable product (MVP) prototype. Eric Ries (2013) discusses the specifics of MVPs and how they can save development time. The UX student used her expertise in human factors and referred to the research-based best practices on Don Norman and Jakob Nielsen’s NN group website (Nielsen Norman Group 2020). Don Norman is a faculty member at the University of California San Diego and one of the forefathers of UX. Jakob Nielsen is an engineer and a principal at the NN group.

The UX and content students conducted a competitive analysis to discover what similar apps existed and what these apps provided to users as Jill DaSilva (2020) discusses. They created a spreadsheet of similar apps and their features. This was the basis of requirements gathering as Janet Six (2019) suggests. The team reviewed the spreadsheet and developed the requirements document using a version of the MOSCOW method (must, should, could, won’t) as discussed in ProductPlan (2020) and then refined this list. Some desired but untenable features were “connecting to a counselor on campus through a chat feature” and “talking to others using the app.” Both of these features would require infrastructure that was unavailable. Then, the UX student organized the architecture of the app discussed by Jen Cardello (2014) and used LucidChart to create the architecture as shown in Figure 1.

A flow chart showing the information architecture.
Figure 1. The information architecture.

After approval, the UX student generated pencil sketches of the screens and then developed the individual screens using the open-source material design pattern library (http://material.io/). Next, the student used the Invision App (https://www.invisionapp.com/) with a free educational license (https://www.invisionapp.com/education) to work out the navigation between the screens. At each stage of this process, her work was approved by the group. The prototype took two weeks longer than anticipated. The Serene app design is stored online at Invision (https://projects.invisionapp.com/share/8DXSLUJCRAK#/screens).

App development team

The development team participated in the discussions of the overall design, the design of the architecture, and the design of the UX. Following creation of the UX design by the UX team, the app development student created a prototype of Serene that followed the UX design and turned the prototype into a fully functioning app product using his expertise in computer science, following weekly discussions with the entire team. The development process consisted of the development of the back end, a Java server that handled the processing and storage of data, and the front-end, the app itself, built using HTML5 and JavaScript with Cordova (https://cordova.apache.org/), providing multi-platform support.

Content team

The content team helped the UX team to research similar apps. A spreadsheet was created to compare similar apps and their functionality. Following discussion with the whole team, the content student developed comprehensive resource lists to provide users with information regarding:

  • Mental health providers in Erie County, Pennsylvania. The list consisted of local agencies and organizations, their contact information, and the target population.
  • Nationwide mental health resources. The list consisted of national mental health hotlines and organizations for various populations.
  • Other mental health smart-phone applications. In collaboration with the UX team, a list was created with all the mental health applications that the team was able to find. The content team assessed the applications and chose a small number of evidence-based applications to suggest in the Serene app as additional applications.
  • Behavioral activities that users could consider doing. Based on psychological principles of behavioral activation (Kanter et al. 2010) to help increase well-being by remaining physically active, the content student used her expertise in counseling psychology to compile a list of various activities users could do across a variety of settings and circumstances (see Appendix B). Given some of the restrictions experienced due to the COVID-19 Pandemic, these resources provide users with ideas for activities they can engage in regardless of pandemic-related circumstances (e.g., socially distant outdoor activities or things to do at home if faced with a stay-at-home order).
  • Motivational quotes. Upon discussion with the whole team, it was decided that three categories of quotes (i.e., psychology quotes, I am… quotes, and motivational quotes) were needed. The content team sought to include at least 365 quotes in each of the three categories thereby ensuring a steady stream of new content (i.e., one new quote from each category for every day of the year) to help promote regular use of the app and gather information on how users were feeling. The final list consisted of approximately 380 quotes for each category.

The content student also used her expertise in counseling to research and write articles that provided users with evidence-based information regarding mental health and COVID-19, all accessible from within the Serene app. The mental health information discussed emotional reactions and stigmatization in mental health. The COVID-19 article was a comprehensive summary of the characteristics of the coronavirus, along with ways individuals can protect themselves. All sources used were either governmental (e.g., CDC and WHO) or other high-quality online resources (see Appendix C; e.g., information from the Bill and Melinda Gates Foundation). These articles and resources assist users in finding valid and reliable information about mental health and the COVID-19 pandemic.

Providing users with this type of information, also referred to as psychoeducation, is a very important component of multiple therapeutic models in mental health services. That is to say, we need to provide information related to the individual mental health concerns of mental health consumers in order to raise awareness and offer a sense of reality and control. Since the Serene app was created as a tool to assist its users with mental health struggles in isolation during the COVID-19 pandemic, our articles are meant to provide users with information about basic mental health concepts like stigma and emotions, as well as information about the coronavirus. Further, many unreputable online resources spread misinformation and inaccuracies that may confuse or even disturb individuals. Therefore, providing reliable resources and psychoeducation to users of the Serene app may also help to decrease potential distress that individuals may face if they were to search for and receive this same information from other, potentially unreliable or misinformative sources.

Finally, the content student’s expertise in counseling helped her to create mindfulness, meditation, and progressive muscle relaxation exercises that users could freely access within the Serene app. For this purpose, appropriate audio recording equipment (Studio Condenser USB Microphone with Adjustable Scissor Arm Stand) was purchased. Moreover, the content student searched online resources to find and adapt scripts and soundtracks for use within the app. The content student recorded the audio for each of the exercises, mixed the audio with background music and visuals, and uploaded each exercise to the team’s YouTube channel, for use within the app. The majority of the content student’s hours were spent in the creation of these exercises because significant time was needed for the student to locate appropriate scripts and soundtracks and to get familiar with the recording equipment and software. By the end, a five-minute recording would take approximately two hours to complete from start to finish.

Student Work and Time

As this was the first time that we had developed an application together, we had many questions about how much time the students should spend and what they should be doing during those hours. Based on our experiences, 50 percent of person-hours were devoted to the app development student, followed by 36 percent to the content student, and 14 percent to the UX student. To help future academic development teams determine a budget, we have included the actual student time/activities as concrete guidance.

UX team

Students were screened in an “Introduction to Human Factors” class on a prototype development assignment (see Appendix A). One of the challenges we had was budgeting for student hours. While these times may not work for every project, here is the time breakdown for the UX student.

UX student time Activity
8 hours Competitive app research
2 hours Helping with content
2.5 hours Information architecture
16.25 hours Meetings—requirements development, review sessions, organizing the project
30 hours Prototyping
8 hours User testing and reporting
2 hours Miscellaneous
Table 1. The time that it took the UX student excluding final user testing.

App development team

Students were screened in a computer science class where coding assignments were a major component. Students’ assignments were reviewed based on their performance, which included the correctness, efficiency, and organization of their written programming code. One student was invited to join the team based on his performance and his availability in the schedule of the development.

App development student time Activity
12 hours Back-end development, including the storage of data on a server and server setup*
205 hours Front-end app development, including the app interface and the connection to the back end
6 hours Miscellaneous
18 hours Meetings
Table 2. The time that it took the app development student excluding submission of the final version to Google Play. *Server setup requires the support of the IT department at the institution, which may take days or weeks depending on the institution. This is not counted in the development table.

Content team

Given the mental health nature of the content to be created for this application, it was important to find a student with expertise in both the research and practice of clinical psychology. Therefore, the student for the content team was hand selected from a clinical psychology graduate program on campus. Prior to working on this project, the student worked as a research assistant for the content team lead. Through this work the student demonstrated several key qualifications for this position, including: a passion for mental health advocacy, a mastery of the material, and the ability to work efficiently and effectively both as part of the team and on an individual level.

Content student time Activity
16 hours Creating a database of county-wide mental health resources (e.g., providers) as well as select nationwide resources (e.g., the National Suicide Prevention Lifeline)
3.5 hours Researching other mental health smartphone applications to list within this app to provide users with additional wellness resources
9 hours Creating a list of behavioral activities users could access to help find things to do across a range of current circumstances (e.g., things to do at home, if faced with a stay-at-home order due to the pandemic; socially distant outdoor activities)
34 hours Collating several lists of positive and inspirational quotes
91.5 hours Producing video content for the app (e.g., mindfulness exercise videos)
16 hours Attending team meetings
3 hours Miscellaneous
Table 3. The time that it took the content student.

Project Development and Implementation

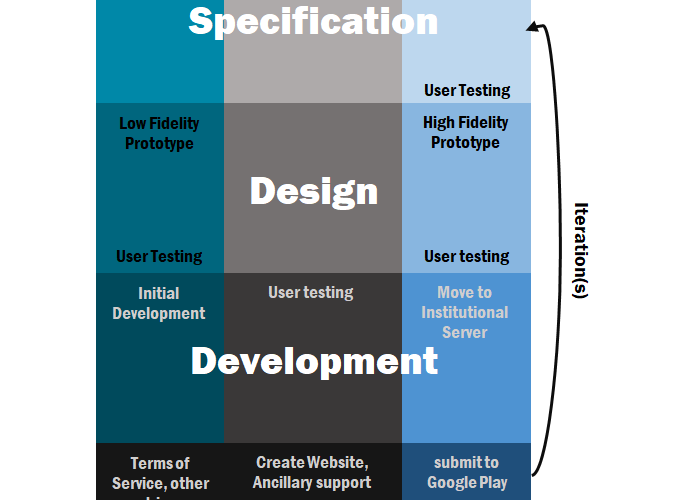
Initial development began in late April 2020 with team organization for the summer and an application for grant funding. Project planning was done using a mix of free templates. For planning purposes, the UX work and content work happened in the first three months. App programming began concurrently in the second month once the initial prototype screens had been determined. User testing began in the third month along with iterations to solve the issues that were discovered. Figure 2 outlines the order in which the development occurred as well as the stages of ideation, solidification, and implementation within each phase. Review was ongoing in each phase. Development finished in the sixth month with submission to Google Play Store in the seventh month. The app was approved and deployed in the eighth month.

A diagram showing the development cycle with four components: specification, design, development, and deployment. Each component is further divided into ideate, solidify, and implement. The four components form one iteration of the cycle.
Figure 2. The development cycle.

Resulting Impacts

In order to keep the team focused and establish a collaboration, a project plan was our first action. Within the project plan was the rationale, the project scope, team composition, team responsibilities, team deliverables, milestone activities, communication management plan, the contact information for each team member, the budget, how the meetings would be conducted, and a quality baseline commitment. All members reviewed and revised the project plan until it was agreeable. The document was critical to the interdisciplinary focus and prevented role drift where one person tries to take over all the roles in the development process.

The Serene app included three opportunities for learning. The first opportunity was to learn more about how a multidisciplinary team could be structured to deliver specific applied skills in an academic setting. The second was the learning environment of developing the app itself. The third occurs in deploying the app to the larger community and learning more about the community’s mental health.

The first learning opportunity gave us a greater appreciation of how each discipline perceived the work and structured priorities. For example, the content group had a great interest in gathering mental health data. At first, the UX and app development teams failed to realize how important biological sex is to mental health data collection and analysis. The content team explained a long-standing issue in the mental health field pertaining to a need to research and better understand biological sex differences in relation to psychopathology as Cynthia Hartung and Thomas Widiger (1998) and Cynthia Hartung and Elizabeth Lefler (2019) discuss. As a result, it is important to ensure that data such as biological sex is collected and analyzed in mental health research to help elucidate whether any potential findings vary by sex. Even through this simple occurrence, the students learned the value of the various perspectives provided by an interdisciplinary team. The team included five options to report sex: prefer not to say, male, female, intersex, and other.

The second opportunity happened both during and after development as we learned to coordinate our expertise. The members of UX, app development, and content teams used their expertise to move the project forward. Faculty mentors coached students on teamwork skills and developed the students’ expertise in separate meetings. The weekly team meetings were opportunities for joint design decisions, review of the work, and progress maintenance by following the four we’s: (a) this is what we were thinking in our role, (b) this is what we did to move the project forward, (c) this is what we think should be done next, (d) what do we think? The forming, storming, norming, and performing stages are well documented (Tuckman 1965), however, in this project a deeper sense of inquiry was necessary to convey respect for each role’s effort. This respect freed individuals from preliminary criticism that would hamper their motivation yet allowed the team to critique the project at critical milestones. For example, the UX team struggled to devise the weekly, monthly, and yearly graphs. During weekly reviews, the team settled on an earlier solution. The UX team enjoyed the freedom to exercise their expertise and intellectually explore the options before the final design decision was made by the team.

The third learning opportunity is ongoing and comes from anonymous user data being collected to identify and address potential mental health inadequacies prevalent in the regional community. Typically, mental health needs outpace the resources available. By creating this app, we not only provided valuable resources to the community during a time of immense need, but we also gained valuable insight into the ongoing needs of our community. For instance, these data allow us to analyze the anonymous, self-reported, mental health data, across time throughout and after the pandemic. It also allows us to examine and better understand what types of local resource content are most applicable to our community members. Ultimately, these data will allow the team to better understand the specific needs of our area, as reported by the community, and can serve to tailor engagement towards addressing specific community needs.

While we often put students in teams in class, they rarely participate in teams across disciplines. This project was a beneficial example of how to construct an interdisciplinary team. Each student responded positively in their comments (see Appendix D): “The biggest challenge was taking what suggestions the development team had and giving them life”; “Nonetheless, working with a large group of experienced professors and students allowed for a painless development process”; and “The main sense that remains with me after the completion of Serene is that of working and communicating with people from various fields who all used their own language, interests, and expertise for the same project.”

Challenges

We encountered several challenges through our development process. They range from technical—data warehousing, quality assurance, design, to legal—terms of service, to managerial—content. The following sections describe each of them.

Data warehousing

One of the first challenges was where to host the programming code as the project developed. Two back-end server hosting solutions were considered. The first was a cloud-based solution, Amazon Web Services (AWS). However, this solution was abandoned due to its ongoing costs associated with storage (AWS Simple Storage Service), computing (AWS Elastic Compute Cloud), and communication (AWS Data Transfer). We chose the second solution, hosting with an internal institutional server using Windows Server. This solution required:

  • Help from IT support from the university in setting up server
  • University computing and storage resources
  • Compliance with university, including accessibility
  • Access to the Google Play Store from a university-owned account

Content

A considerable amount of time was spent in finding mindfulness scripts, soundtracks, and images with no copyrights. Also, the composition of the audio files was quite challenging, and particularly the pairing of the soundtrack with the narrative. The first few recordings took many hours to complete. Finally, the list with the quotes was unexpectedly time consuming, as the content team had to proof-read the quotes and ascertain the authors for all the quotes that appeared “unknown” during the search.

Many of the resources were kept in a spreadsheet file. The team decided to use html tags so the app could easily access the spreadsheet resources and use those resources, as is, within the app. The content team easily learned the tags and adapted.

Institutional Review Board

We found that we needed two reviews for human subjects research. One was for user testing during development. The other was for using the data that the app gathered. As this second review of data had information that was not identifiable to a person, it was determined that this was not human subjects’ data.

Attorney services

There were many questions about how to best navigate terms of service and data use. We worked closely with the legal department at our institution through the corporate liaison officer to implement a terms of service appropriate to the general nature of the app and for the information on the data and how it would be used. Since the Serene app has a mental health focus, it was essential to ensure that it was not used as a substitute for medical care and that the development team and the university could not be held liable for any such misuse. Therefore, the corporate liaison consulted with the university’s offices of risk management and general counsel. These offices helped to craft simple, understandable terms of service and data usage language. As the app was produced by the students, we chose to provide that information on the accompanying website rather in the app itself.

Design of charts

Other challenges included problems related to a specific content area. In UX/UI- there was quite a bit of work on how the charts would look. Initially, we considered a complex line and bar chart such as in Figure 3.

Figure 3. A line plot charts 'anxious', 'boredom' and 'anger.' While 'anger' hovers at the lowest level, rising toward the end, 'anxious' comes to overtake 'boredom' at the end, after an uneven dip below.
Figure 3. Initial prototype for tracking emotions.

However, this chart was too complex for the small real estate on a mobile phone screen and did not capture the weekly, monthly, and yearly changes. Then, we tried three different charts as shown in Figures 4 to 6.

Figure 4. A line plot of weekly progress showing how three types of emotions change on a weekly basis. One emotion starts with a high value and then drops to a low value towards the end.
Figure 4. Prototype of weekly progress.
Figure 5. A bar graph of monthly progress showing how three types of emotions change on a monthly basis. Each emotion is represented by a differently-colored bar. The emotion represented by the orange color starts with a high value and then drops to a low value towards the end.
Figure 5. Prototype of monthly progress.
Figure 6. A filled area graph of yearly progress showing how three types of emotions change on a yearly basis. Each emotion is represented by a differently-colored area. The values of the three emotions change from year to year.
Figure 6. Prototype of yearly progress.

User testing

In order to discover how well the design was understood, we conducted user testing with five undergraduate students from the psychology course testing pool which was approved by the IRB. The UX student used standard user testing methodologies as recommended on NN group’s user testing videos (Nielsen Norman Group 2020). In the user testing, participants were asked to do three tasks: Find a mindfulness video, find an activity to do on the phone/computer, and find a local resource for depression. Then, the researcher took note of any problems the participant had and how long it took each participant to do each task along with satisfaction ratings as described by Erik Frøkjær, Morten Hertzum, and Kasper Hornbæk (2000). Participants in user testing found that some of the labels were unclear and there was confusion about where to find specific tasks within the app. There were also questions about the use of a password and if users would be able to use the app on their Android phone and on the web. Users said that they would like a password, but this would invalidate some of the anonymity of the data and could cause some late-stage development changes. Thus, we decided to leave the password issue to the future releases and comments were gathered.

Quality assurance team

Once the code is working, there needs to be a dedicated team that tests the app, looks for the weaknesses and finds out if there are bugs that might break the app. We did not have such a team and instead functioned as our own quality-assurance team along with friends who volunteered their time. This method took longer and a professional-level assurance team should be included in the budget.

Conclusions and Future Directions

Despite the challenges encountered during the development of the app, the combination of talents into one interdisciplinary team allowed the creation of a completed product that far exceeded what one discipline could accomplish alone. One purpose of the project was to give the students the experience of working in a structured and distributed environment with a team that was segregated by roles but followed an agile software development approach, where development happened in an iterative way. Professors spent additional hours mentoring the students on teamwork and communication as well as learning about the other roles. Working together while maintaining a constant line of communication was key to its success. Having regular stages of reviews during the development cycle helped guide the process in the right direction. Using the right collaboration tools, such as Microsoft Teams, Google Docs, and GitHub, made team work much easier. The Serene app is available through Google Play and can be accessed on the Serene website.

Knowing that the project would result in an app launched to a large community of potential users provided ample motivation to meet the learning and performance needs for successful completion of the project. Learning requirements were high and extended well beyond knowledge gained in coursework. Also, it did not go unnoticed by the students that the audience for this project was external to the university, and it motivated them to take extra care and expend extra effort in their work. Working within an interdisciplinary team that extends beyond students to include university faculty and staff helped the students to broaden their perspective of app development work to include the work of the other teams, focus their thinking on alignment of the project with the mission of the university, understand potential legal responsibilities, and value meeting the expectations of external stakeholders. For example, the funding agency has a strong local focus, so the students had to be sure to target a sufficient portion of the app’s functionality toward a regional audience.

Our university is highly focused on being an Open Lab (Birx, Ford and Payne 2013), an interdisciplinary living laboratory where learning and discovery are applied to solve problems defined in partnership with external stakeholders. The Open Lab concept evolved from the idea of research clusters working on pressing local problems. The Open Lab is a win for students, faculty, and the external organizations: students gain career-building, real-world experience; faculty enjoy the ability to keep their skills relevant and transfer their networks to students; and external partners benefit from the energy and ingenuity of student talent. More information can be found at the Open Lab website through the university homepage (https://behrend.psu.edu). This project aligns with that focus, as it creates an outward-facing product that receives and engages with feedback from the external community, adding motivation and accountability to the students’ work. It is notable that all students acknowledged the value that this experience provided to them and their career development. Students involved in this team left individual comments regarding their experience (see Appendix D).

We plan on continuing an extension of this project. For future work, psychology content can be updated and expanded with additional mental health or COVID-19 focused information, resources, or the creation and addition of new wellness exercises that users can freely access from within the Serene app. We have deployed the app and are monitoring user feedback. Additional user testing will be conducted based on user feedback. We also plan to deploy the app to iOS. When recruiting undergraduate students, it is a good idea to have overlapping years. There should be some second-year students, some third-year students, and some senior students. This approach ensures smooth transitions for projects having a multi-year life expectancy.

Bibliography

Birx, Donald L., Ralph M. Ford, and Carrie A. Payne. 2013. “The University as an Open Laboratory.” Journal of Research Administration 44, no. 2: 11–37.

Blackwell, Alan F., Lee Wilson, Alice Street, Charles Boulton, and John Knell. 2009. “Radical Innovation: Crossing Knowledge Boundaries with Interdisciplinary Teams.” Department of Computer Science and Technology Technical Reports UCAM-CL-TR-760, November 2009. https://www.cl.cam.ac.uk/techreports/UCAM-CL-TR-760.html.

Brodack, Franziska, and Anna Sinell. 2017. “Promoting Entrepreneurial Commitment: The Benefits of Interdisciplinarity.” Technology Innovation Management Review 7, no. 12: 6–13. http://doi.org/10.22215/timreview/1123.

Cardello, Jen. 2014. “The Difference between Information Architecture and Navigation.” NN group, November 26, 2020. https://www.nngroup.com/articles/ia-vs-navigation/.

Centers for Disease Control and Prevention. 2019. “Coping with Stress.” CDC, January 22, 2021. https://www.cdc.gov/coronavirus/2019-ncov/daily-life-coping/managing-stress-anxiety.html.

DaSilva, Jill. 2020. “A Guide to Competitive Analysis for UX Design.” Adobe, June 12, 2020. https://xd.adobe.com/ideas/process/user-research/guide-to-competitive-analysis-ux-design/.

Fernández, Rodrigo S., Lucia Crivelli, Nahuel Magrath Guimet, Ricardo F. Allegri, and Maria E. Pedreira. 2020. “Psychological Distress Associated with COVID-19 Quarantine: Latent Profile Analysis, Outcome Prediction and Mediation Analysis.” Journal of Affective Disorders 277: 75–84. https://doi.org/10.1016/j.jad.2020.07.133.

Frøkjær, Erik, Morten Hertzum, and Kasper Hornbæk. 2000. “Measuring Usability: Are Effectiveness, Efficiency, and Satisfaction Really Correlated?” Proceedings of the SIGCHI Conference on Human Factors in Computing Systems 2, no.1: 345–352.

Hartung, Cynthia M., and Elizabeth K. Lefler. 2019. “Sex and Gender in Psychopathology: DSM-5 and Beyond.” Psychological Bulletin 145, no. 4: 390–409. https://doi.org/10.1037/bul0000183.

Hartung, Cynthia M., and Thomas A. Widiger. 1998. “Gender Differences in the Diagnosis of Mental Disorders: Conclusions and Controversies of the DSM–IV.” Psychological Bulletin 123, no. 3: 260–278. https://doi.org/10.1037/0033-2909.123.3.260.

Ho, Cyrus Sh, Cornelia Yi Chee, and Roger Cm Ho. 2020. “Mental Health Strategies to Combat the Psychological Impact of COVID-19 Beyond Paranoia and Panic.” Annals Academy of Medicine, Singapore 49, no. 1: 1–3.

Kanter, Jonathan W., Rachel C. Manos, William M. Bowe, David E. Baruch, Andrew M. Busch, and Laura C. Rusch. 2010. “What is Behavioral Activation?: A Review of the Empirical Literature.” Clinical Psychology Review 30, no. 6: 608–620. https://doi.org/10.1016/j.cpr.2010.04.001.

Kar, Sujita Kumar, SM Yasir Arafat, Russell Kabir, Pawan Sharma, and Shailendra K. Saxena. 2020. “Coping with Mental Health Challenges During COVID-19.” In Coronavirus Disease 2019 (COVID-19). Medical Virology: From Pathogenesis to Disease Control, edited by Shailendra K. Saxena. Singapore: Springer.

Luxton, David D., Russell A. McCann, Nigel E. Bush, Matthew C. Mishkind, and Greg M. Reger. 2011. “mHealth for Mental Health: Integrating Smartphone Technology in Behavioral Healthcare.” Professional Psychology: Research and Practice 42, no. 6: 505–512.

Moirano, Regina, Marisa Analía Sánchez, and Libor Štěpánek. 2020. “Creative Interdisciplinary Collaboration: A Systematic Literature Review.” Thinking Skills and Creativity 35, no. 100626: 1–14. https://doi.org/10.1016/j.tsc.2019.100626.

Naeem, Farooq, Muhammad Irfan, and Afzal Javed. 2020. “Coping with COVID-19: Urgent Need for Building Resilience Through Cognitive Behaviour Therapy.” Khyber Medical University Journal 12, no. 1: 1–3. https://doi.org/10.35845/kmuj.2020.20194.

Nielsen Norman Group. 2020. “User testing.” NN group, June 3, 2020. https://www.nngroup.com/videos/user-testing-jakob-nielsen/.

Pierce, Matthias, Holly Hope, Tamsin Ford, Stephani Hatch, Matthew Hotopf, Ann John, Evangelos Kontopantelis et al. 2020. “Mental Health Before and During the COVID-19 Pandemic: a Longitudinal Probability Sample Survey of the UK Population.” The Lancet Psychiatry 7, no. 10: 883–892. https://doi.org/10.1016/S2215-0366(20)30308-4.

ProductPlan. 2020. “MoSCoW Prioritization.” ProductPlan, November 25, 2020. https://www.productplan.com/glossary/moscow-prioritization/.

Ries, Eric. 2013. “Building the Minimum Viable Product.” Stanford Technology Ventures Program, August 28, 2013. https://youtu.be/1FoCbbbcYT8.

Saltzman, Leia Y., Tonya Cross Hansel, and Patrick S. Bordnick. 2020. “Loneliness, Isolation, and Social Support Factors in Post–COVID-19 Mental Health.” Psychological Trauma: Theory, Research, Practice, and Policy 12, no. S1: S55–S57. https://dx.doi.org/10.1037/tra0000703.

Six, Janet M. 2019. “Eliciting Business Requirements.” UX Matters, April 23, 2019. https://www.uxmatters.com/mt/archives/2019/04/eliciting-business-requirements.php.

Tuckman, Bruce W. 1965. “Developmental sequence in small groups.” Psychological Bulletin 63, no. 6: 384–399.

Appendix A: UX Screening Assignment

Instructions</h3
For this project, I want you to imagine that you have been hired to create a prototype for a mythical application. The goal of the application is to reach out to people who are feeling anxious and provide them with mental health resources and exercises to help. Boredom is part of anxiety, so it also addresses boredom. The red route in this app is that people should be able to report their level of anxiety and then get a breathing exercise and then get the phone numbers of mental health professionals. Please use one of these programs: Adobe XD (inside Adobe Creative Suite), or Figma, or Invision to create a prototype for this app. Your prototype must be designed for an Android phone and have at least one screen for each box in the information architecture outline which is here in Figure 7.

Figure 7. A flow chart showing the architecture used by the screening assignment – See outline.
Figure 7. The architecture that the assignment used.

Each screen must show the choices that would bring you to the next screen (yes/no). The screens must use the Material design pattern library which is here: https://material.io/. Once you are finished with all the screens and they are linked so that they work as an app would, please turn in the URL. I don’t want the screens or the file, just the URL for the prototype.

Appendix B: Activities Provided to Users Within the Serene App

Activity Category Type Activity
Indoors Cook/Bake a new recipe
Indoors Take a nap (or two)
Indoors Do a jigsaw puzzle
Indoors Organize your room
Indoors Take a (long) bath/shower
Indoors Clean your room/house
Indoors Try out DIY crafts
Indoors Organize your cabinets
Indoors Throw away expired items
Indoors Redecorate your room/house
Indoors Repaint your room/house
Indoors Reorganize your closet (check out Marie Kondo)
Indoors Fix broken items
Indoors Plan your outfits (even your “Zoom” ones)
Indoors Clean your electronic devices
Indoors Do your laundry
Indoors Clean your fridge
Indoors Create an emergency kit
Indoors Cook/Bake for your friends or co-workers
Indoors Rearrange your furniture
Indoors Make a pillow fort
Indoors Make a cardboard house
Indoors Take care of your plants
Indoors Sing around the house
Indoors Cook a Michelin worthy meal
Indoors Meal prep for the week/month (it will change your life)
Indoors Change your bedsheets
Indoors Organize your workspace
Indoors Shave
Indoors Cook an international cuisine
Indoors Make home-made “fast food” (pizza, tacos, etc.)
Indoors Grow an indoor kitchen garden
Indoors Make your own peanut butter and jam
Outdoors Start a vegetable garden
Outdoors Clean out your car (Beware!)
Outdoors Plant flowers
Outdoors Find a place to volunteer
Outdoors Go to church
Outdoors Sell stuff you don’t need
Outdoors Go on a solo date
Outdoors Go for a walk/run
Outdoors Go for a bike ride
Outdoors Plan and go on a scavenger hunt
Outdoors Make a cardboard house
Outdoors Birdwatch
Outdoors Go for a drive
Outdoors Have a bonfire (and roast marshmallows, of course)
Outdoors Sunbathe (don’t forget your sunscreen)
Outdoors Take care of your plants
Outdoors Fly a kite
Outdoors Go camping (and roast marshmallows, again)
Outdoors Walk on the beach/riverfront
Outdoors Go roller-skating
Outdoors Go hiking
Outdoors Go out for dinner/lunch to a new restaurant
Outdoors Go fishing
Outdoors Gaze at the stars (appease the romantic in you)
Outdoors Go on a picnic
Outdoors Go to a coffee shop (no, not the drive-thru)
Outdoors Have a barbecue
Outdoors Spend time in nature
Outdoors Go to home opens
Outdoors Walk around the city
Outdoors Mow your lawn
Outdoors Build a bird house/feeder
Outdoors Go to a scenic spot and enjoy the view
Outdoors Learn tricks with a jumping rope
Outdoors Turn your yard into an outdoor cinema
Outdoors Take your dog to the park
Outdoors Check out geocaching (yes, it is still a thing)
Outdoors Let out some energy by screaming or running around like crazy (not recommended if you live near people)
Outdoors Build a hammock
Outdoors Watch the sunset/sunrise
Outdoors Build a sandcastle
Entertainment Watch YouTube videos
Entertainment Binge-watch a new TV show
Entertainment Play a video game
Entertainment Read a book/magazine
Entertainment Blast some music
Entertainment Discover new music
Entertainment Visit museums virtually
Entertainment Watch a documentary
Entertainment Read your favorite blogs/find new ones
Entertainment Listen to your favorite podcast/find new ones
Entertainment Play online games with your friends/family
Entertainment Make a new playlist
Entertainment Make a playlist for every mood
Entertainment Download fun apps
Entertainment Listen to an audiobook
Entertainment Watch a Disney movie
Entertainment Learn a magic/card trick
Entertainment Dig out old board games
Entertainment Listen to the radio
Entertainment Re-watch your all-time favorite movies
Entertainment Have a movie marathon
Entertainment Read a comic book (DC or Marvel?)
Socializing Text/call someone you haven’t talked for a long time
Socializing Play online games with your friends/family
Socializing Take on a new challenge with your friends/family
Socializing Ask your parents and grandparents about their childhood
Socializing Find a place to volunteer
Socializing Go to church
Socializing Throw a themed Zoom party
Socializing Call your grandparents
Socializing Plan your next vacation/get-away (visualize that the Earth and people are fine again)
Socializing Contact a distant relative
Socializing Talk with your family
Socializing Plan/Go on a road trip
Socializing Go old school and get a pen pal
Socializing Have a class reunion (Zoom makes it easier)
Socializing Don’t take your loved ones for granted and remind them that you love them
Socializing Plan a Zoom trivia night
Socializing Teach a skill to someone
Socializing Plan a surprise for someone
Socializing Get to know your neighbors
Socializing Spread some positive energy and give someone a genuine compliment
Pen & Paper Draw/Paint/Doodle
Pen & Paper Do a painting tutorial
Pen & Paper Create a bucket list
Pen & Paper Write thank-you cards
Pen & Paper Start a journal
Pen & Paper Create a healthy meal plan (and follow it)
Pen & Paper Schedule your week/month/year
Pen & Paper Solve brainteasers/crosswords
Pen & Paper Make a list of your favorite quotes (Serene can help you out with this)
Pen & Paper Make a travel bucket list
Pen & Paper Write a letter to your future self
Pen & Paper Start a gratitude journal
Pen & Paper Color an adult coloring book
Pen & Paper Make a list with all the things that make you happy
Pen & Paper Create a list with all the things you don’t know and want to Google
Pen & Paper Write a poem/essay/story/song
Pen & Paper Design your dream house (maybe log in your Sims account?)
Pen & Paper Plan your next vacation/get-away (visualize that the Earth and people are fine again)
Pen & Paper Make a pros-cons list to help you make a decision
Pen & Paper Plan/Go on a road trip (Google themed road trips; you won’t regret it)
Pen & Paper Learn calligraphy
Pen & Paper Follow a writing prompt
Pen & Paper Document all the self-isolation days by photography or writing for the future generations to see
Personal Growth Read a book/magazine
Personal Growth Visit museums virtually
Personal Growth Watch a documentary
Personal Growth Organize your finance
Personal Growth Start a journal
Personal Growth Create a healthy meal plan (and follow it)
Personal Growth Make a list of your goals with 3 logical and feasible steps to achieve them
Personal Growth Learn a new language (well, get started at least)
Personal Growth Update your resume
Personal Growth Watch TED-Talks
Personal Growth Start a gratitude journal
Personal Growth Learn how to play an instrument
Personal Growth Listen to an audiobook
Personal Growth Apply for a new job
Personal Growth Plan your future education
Personal Growth Look for online/free certificates
Personal Growth Make a list with all the things that make you happy
Personal Growth Expand your vocabulary (appease your intellectual self)
Personal Growth Do the one thing you have been putting off (you know what we are talking about)
Personal Growth Make a plan to pay out your debt
Personal Growth Learn how to build up a good credit
Personal Growth Find a place to volunteer
Personal Growth Practice your religion
Personal Growth Learn about spirituality
Personal Growth Research ways to make your living situation more sustainable and “green”
Personal Growth Research about other cultures
Personal Growth Update your LinkedIn
Personal Growth Create a vision board
Personal Growth Start a money saving challenge
Personal Growth Take a fun online course
Personal Growth Google things that interest you
Personal Growth Finish unfinished projects
Personal Growth Research fitness/wellness videos/blogs
Personal Growth Learn more about finance and budgeting
Personal Growth Make a pros-cons list to help you make a decision
Personal Growth Create a savings plan
Personal Growth Learn a new skill
Personal Growth Learn a graphic design program
Personal Growth Learn first aid
Personal Growth Explore career options
Personal Growth Buy a newspaper to read with your morning coffee instead of checking your phone
Personal Growth Teach a skill to someone
Personal Growth Spread some positive energy and give someone a genuine compliment
Personal Growth Dance (like no one is watching)
Personal Growth Play with your pet or teach it a new trick
Personal Growth Exercise
Personal Growth Practice a new physical activity
Personal Growth Do yoga
Personal Growth Stretch (daily if possible)
Personal Growth Go for a walk/run
Personal Growth Go for a bike ride
Personal Growth Do aerobics (remember Zumba?)
Personal Growth Try out martial arts/self-defense
Personal Growth Go swimming
Personal Growth Go roller-skating
Personal Growth Go hiking
Personal Growth Play your favorite sports
Personal Growth Walk around the city
Personal Growth Learn tricks with a jumping rope
Computer/Phone Play a video game
Computer/Phone Visit museums virtually
Computer/Phone Back-up your computer
Computer/Phone Play online games with your friends/family
Computer/Phone Make a new playlist
Computer/Phone Make a playlist for every mood
Computer/Phone Watch TED-Talks
Computer/Phone Declutter your emails
Computer/Phone Download fun apps
Computer/Phone Create a TikTok video
Computer/Phone Delete old contacts from your phone
Computer/Phone “Get lost” with Google Sky and Google Maps
Computer/Phone Search for birthday gifts for your loved ones
Computer/Phone Unsubscribe your email from newsletters
Computer/Phone Sell stuff you don’t need
Computer/Phone Organize your documents
Computer/Phone Google things that interest you
Computer/Phone Research fitness/wellness videos/blogs
Computer/Phone Leave a positive review on Amazon (because we all need some positive in our lives)
Computer/Phone Make a wish-list on Amazon
Computer/Phone Make a to-watch list on IMDB
Computer/Phone Make a to-read list on Goodreads
Computer/Phone Update your social media bio(s)
Computer/Phone Learn a graphic design program
Computer/Phone Start a blog
Other Organize your pictures
Other Start a new challenge
Other Practice relaxation techniques
Other Meditate
Other Look into your family tree
Other Put together a family history book
Other Go through old pictures
Other Stay hydrated and drink more water
Other Practice breathing techniques
Other Do a picture challenge-take pictures with certain themes
Other Care for your pet
Other Do a pet photoshoot
Other Sew something
Other Patch up an old blanket
Other Make a short movie
Other Try out a new makeup look
Other Try out a new hairstyle
Other Keep track of your alcohol/caffeine intake
Other Start a collection (coins, shells, stamps, etc.)
Other Organize your picturesTry embroidery/cross stitching/crocheting/knitting
Other Go to a beauty salon (applies to all genders)
Other Babysit for a friend/neighbor (kids are fun)
Other Daydream like everything is possible
Other Spend a day with children
Other Play dress-up
Other Light up candles and relax
Other Do some research for the best deal on the things you want to buy
Other Do a favor for someone
Other Donate blood
Other Turn off your electronic devices for an hour
Other Blow bubbles
Other Try out origami
Other Do something nostalgic (listen to old songs, watch old pictures, etc.)

Appendix C: Sources Used for the Mental Health and COVID-19 Content Articles

BBC. “Coronavirus global update” bb.co.uk
https://www.bbc.co.uk/programmes/w13xtv39

Bill and Melinda Gates Foundation. “COVID-19” gatesfoundation.org
https://www.gatesfoundation.org/TheOptimist/coronavirus

Centers for Disease Control and Prevention (CDC). “Coronavirus (COVID-19)” cdc.gov
https://www.cdc.gov/coronavirus/2019-nCoV/index.html

COVID-19 facts. “COVID-19 facts” covid-19facts.com
https://www.covid-19facts.com/

Department of Homeland Security. “Master question list for COVID-19 (caused by SARS-CoV-2)” dhs.gov
https://www.dhs.gov/publication/st-master-question-list-covid-19?fbclid=IwAR0R7XbMPaANzMYahmW311zv2Iekk-eVIn97xlk8VPUvD_hgZAlKS9qPASU

Inside Higher Ed. “Live updates: Latest news on coronavirus and higher education” insidehighered.com
https://www.insidehighered.com/news/2020/05/29/live-updates-latest-news-coronavirus-and-higher-education

Law librarians of Congress. “Coronavirus resource guide” loc.gov
https://blogs.loc.gov/law/2020/03/coronavirus-resource-guide/

National Center for Biotechnology Information (NCBI). “LitCOVID” ncbi.nlm.nih.gov
https://www.ncbi.nlm.nih.gov/research/coronavirus/

National Institute of Health (NIH, official website). “Coronavirus (COVID-19)” nih.gov
https://www.nih.gov/coronavirus

National Institute of Health (NIH). “Open-Access Data and Computational Resources” nih.gov
https://datascience.nih.gov/covid-19-open-access-resources

Occupational Safety and Health Administration (OSHA). “COVID-19” osha.gov
https://www.osha.gov/SLTC/covid-19/

Pennsylvania Department of health. “Coronavirus (COVID-19)” health.pa.gov
https://www.health.pa.gov/Pages/default.aspx

Rapid reviews. “Rapid reviews: COVID-19” rapidreviewscovid19.mitpress.mit.edu
https://rapidreviewscovid19.mitpress.mit.edu/

Surgo Foundation. “Bringing greater precision to the COVID-19 response” precisionforcovid.org
https://precisionforcovid.org/

The U.S. Census Bureau. “COVID-19 Demographic and economic resources” covid19.census.gov
https://covid19.census.gov/

The U.S. Food and Drug Administration (FDA). “Coronavirus disease 2019 (COVID19)” fda.gov
https://www.fda.gov/emergency-preparedness-and-response/counterterrorism-and-emerging-threats/coronavirus-disease-2019-covid-19

The U.S. Department of Health and Human Services (HHS). “Coronavirus (COVID-19)” coronavirus.gov
https://www.coronavirus.gov/

Very Well Mind. “Emotions and types of emotional responses” verywellmind.com https://www.verywellmind.com/what-are-emotions-2795178#citation-1

World Health Organization (WHO). “Coronavirus disease (COVID-19) pandemic” who.int
https://www.who.int/emergencies/diseases/novel-coronavirus-2019

Appendix D: Student Feedback

UX student

When we created the app, the challenge was how to make the app feel calm and soothing while the potential users were in the app. Research on what apps were already available and what features they offered helped me to shape what I wanted the app to look like—leading to the blues and nature theme throughout the app. The biggest challenge was taking what suggestions the development team had and giving them life. There were several changes along the way as we got into the development of content. I think that is one of the interesting points of being a UX researcher, is the continued changes that must happen along the way as we progress with the application. The journey from starting the app to finishing my part with the development of the app has been a really great experience and it has given me skills that I can build upon and take into my career with me. An exciting part of this app development for me is that this will not only be available to university students but the whole community as well, which is a point that helped me to create a mental health app that is visually soothing and helpful for those users.

App development student

While developing the application, I learned many new skills and faced just as many challenges. Throughout college, I have never worked on a project of this scale. This forced me to apply my, somewhat entry level, skills as a web/application developer and build upon them immensely. This included countless hours of experimentation and research in concepts that were new to me. If I had to choose two skills that I am grateful for learning through the development process, it would be working with Amazon Web Services and Windows Server. It is one thing to develop an application on your computer at home, but it is a completely new experience when the application is running on a server for everyone to enjoy. Amazon Web Services makes the process of hosting an application simple but working with a Windows Server proved to be a much greater challenge. This required working within the limitations of the server’s security and, on many occasions, discussing with the IT department to make changes to the server that I did not have clearance to access. Nonetheless, working with a large group of experienced professors and students allowed for a painless development process. Overall, I have gained valuable experience and knowledge that will be beneficial to my future and I enjoyed it along the way.

Content student

The first unexpected challenge was the creation of the “Quote” list. I had to track down the authors of the quotes that appeared as “by unknown” during the search and also check the background of each author to assure that a certain identity was real and the person had a capacity that allowed them to say the specific quote.

The next and biggest challenge was the creation of mindfulness exercises. First, I had to familiarize myself with the digital audio editing software (Audacity). Second, during the recording, I had to assure that the words were being pronounced correctly. As an international student with English being my second language, I had to re-record the same sentence multiple times or even record word by word until I had a final output where my accent was as indistinct as possible. Finally, pairing a recording with a soundtrack had its own difficulties, as the soundtracks were typically shorter than the recordings and I had to assure that the transition from one track to another was smooth and did not interfere with the recording.

The final challenge was the composition of the two brief articles about mental health. This task required a significant amount of merely thinking, trying to narrow down to specifics all the knowledge I had as a clinical psychology student. I had a large amount of information available, but my task was to provide a very specific and, at the same time, comprehensive summary of it all. I also tried to avoid writing based on my own biases and opinions. Finally, I had to use everyday language to explain scientific terms and concepts that would make sense to people unfamiliar with the field.

What I had not realized until I started working on the tasks was that when I was providing the users with every piece of information I had to be completely valid, reliable, and accurate at all levels. I had to be as meticulous as I could. The main sense that remains with me after the completion of Serene is that of working and communicating with people from various fields who all used their own language, interests, and expertise for the same project. In a very short period of time, I was able to gain an experience valuable for my academic and professional future.

Acknowledgments

This project was funded by the Erie County Gaming Revenue Authority. We thank the two reviewers for their insightful comments, and also thank Kris McLain.

About the Authors

Antigoni Kotsiou was the primary content developer on the project. She graduated from Penn State Behrend with an MA in Applied Clinical Psychology. She works as a therapist providing treatment to children, adolescents, and young adults with trauma history and/or other mental health and behavioral concerns. Her research interests include therapeutic processes, techniques, and models, and psychopathology. She is interested in qualitative research and the subjective experiences of those involved in psychotherapy and mental health services. Her responsibility in the Serene project was to create the content based on various psychotherapy theories and models, such as cognitive therapy and mindfulness.

Erica Juriasingani was the primary UX/UI developer on the project. She is a human factors psychology student at Penn State Behrend and is currently completing her last semester. She is working as a UX Researcher with Innovation Commons at Behrend and plans to continue pursuing UX work after her graduation.

Marc Maromonte was the primary software developer on the project. He is an engineering student at Penn State University and is currently completing his Bachelor of Science in computer science. He is currently working as an Application Developer with Innovation Commons at Penn State Behrend. He plans to continue pursuing software development after his graduation.

Jacob Marsh is the Industry Relations Coordinator at Penn State Behrend. Jacob has a bachelor’s degree in biochemistry from Grove City College, a history in virology research at Penn State Hershey, and a master’s degree in project management from Penn State World Campus. He was instrumental in founding, and currently oversees, the Innovation Commons at Penn State Behrend, a product design and rapid prototyping center staffed by undergraduate students, as part of the Invent Penn State initiative. Jacob also helps develop, fund, and manage various other programs involving entrepreneurship, economic development, and industrial partnerships with Penn State Behrend.

Christopher R. Shelton is an Assistant Professor of Clinical Psychology and the director of the Virtual/Augmented Reality Lab at Penn State Behrend. He has significant clinical experience providing diagnosis, assessment, and treatment for mental health concerns across a wide spectrum of the population. His current research focuses on: (a) examination of ADHD and Sluggish Cognitive Tempo; (b) development of digital mental health assessments and interventions to increase treatment availability; and (c) the use of immersive technologies, such as augmented and virtual reality, across a range of domains. Dr. Shelton earned his Ph.D. in Clinical Psychology from the University of Wyoming.

Richard Zhao is an Assistant Professor in the Department of Computer Science at the University of Calgary. He led the app development team on the Serene project. His current research group focuses on serious games for training and education where he utilizes artificial intelligence, virtual reality, and eye-tracking technologies for this purpose. He received his M.S. and Ph.D. in Computing Science from the University of Alberta. Dr. Zhao was a faculty member at Penn State Behrend.

Lisa Jo Elliott is an Assistant Teaching Professor at Penn State Behrend where she directs the Laboratory for Usability and Interactive Systems – LUIS lab. This lab and Innovation Commons lead a multi-million-dollar grant for a UX-first product design lab. This initiative is one of the first UX-centric product design labs in the United States. It trains UX, UI, interaction design, and experience design students to be future product designers and developers in the engineering, DIGIT, and psychology programs at Penn State Behrend. Dr. Elliott has a Ph.D. from New Mexico State University, Las Cruces, NM, USA.

0

Interdisciplinarity and Teamwork in Virtual Reality Design

Abstract

Virtual Reality Design has been co-taught annually at Vanderbilt University since 2017 by professors Bobby Bodenheimer (Computer Science) and Ole Molvig (History, Communications of Science and Technology). This paper discusses the pedagogical and logistical strategies employed during the creation, execution, and subsequent reorganization of this course through multiple offerings. This paper also demonstrates the methods and challenges of designing a team-based project course that is fundamentally structured around interdisciplinarity and group work.

Introduction

What is virtual reality? What can it do? What can’t it do? What is it good/bad for? These are some of the many questions we ask on the first day of our course, Virtual Reality Design (Virtual Reality for Interdisciplinary Applications from 2017–2018). Since 2017, professors Ole Molvig of the History Department and Bobby Bodenheimer of Computer Science and Electrical Engineering have been co-teaching this course annually to roughly 50 students at a time. With each offering of the course, we have significantly revamped our underlying pedagogical goals and strategies based upon student feedback, the learning literature, and our own experiences. What began as a course about virtual reality has become a course about interdisciplinary teamwork.

Both of those terms, interdisciplinarity and teamwork, have become deeply woven into our effort. While a computer scientist and a historian teach the course, up to ten faculty mentors from across the university participate as “clients.” The course counts toward the computer science major’s project-class requirement, but nearly half the enrolled students are not CS majors. Agile design and group mechanics require organizational and communication skills above all else. And the projects themselves, as shown below, vary widely in the topic and demands, requiring flexibility, creativity, programming, artistry, and most significantly, collaboration.

This focus on interdisciplinary teamwork, and not just in the classroom, has led to a significant, if unexpected, outcome: the crystallization of a substantial community of faculty and students engaging in virtual reality related research from a wealth of disciplinary viewpoints. Equipment purchased for the course remain active and available throughout campus. Teaching projects have grown into research questions and collaborations. A significant research cluster in digital cultural heritage was formed not as a result of, but in synergy with, the community of class mentors, instructors, and students.

Evolution of the Course

Prior to offering the joint course, both Bodenheimer (CS) and Molvig (History) had previously offered single-discipline VR based courses.

From the Computer Science side, Bodenheimer had taught a full three-credit course on virtual reality to computer science students. In lecture and pedagogy this course covered a fairly standard approach to the material for a one semester course, as laid out by the Burea and Coiffet textbook or the more recent (and applicable) Lavalle textbook (Lavalle 2017). Topically, the course covered such material as virtual reality hardware, displays, sensors, geometric modeling, three-dimensional transformations, stereoscopic viewing, visual perception, tracking, and the evaluation of virtual reality experiences. The goal of the course was to teach the computer science students to analyze, design, and develop a complex software system in response to a set of computing requirements and project specifications that included usability and networking. The course was also project-based with teams of students completing the projects. Thus it focused on collaborative learning, and teamwork skills were taught as part of the curriculum, since there is significant work that shows these skills are best taught and do not emerge spontaneously (Kozlowski and Ilgen 2006). This practice allowed a project of significant complexity to be designed and implemented over the course of the semester, giving a practical focus to most of the topics covered in the lectures.

From History, Molvig offered an additional one credit “lab course” option for students attached to a survey of The Scientific Revolution. This lab option offered students the opportunity to explore the creation of and meaning behind historically informed re-constructions or simulations. The lab gave students their first exposure to a nascent technology alongside a narrative context in which to guide their explorations. Simultaneous to this course offering, Vanderbilt was increasing its commitment to the digital humanities, and this course allowed both its instructor and students to study the contours of this discipline as well. While this first offering of a digital lab experience lacked the firm technical grounding and prior coding experience of the computer science offering, the shared topical focus (the scientific revolution) made for boldly creative and ambitious projects within a given conceptual space.

Centering Interdisciplinarity

Unlike Bodenheimer, Molvig did not have a career-long commitment to the study of virtual reality. Molvig’s interest in VR comes rather from a science studies approach to emergent technology. And in 2016, VR was one of the highest profile and most accessible emergent technologies (alongside others such as artificial intelligence, machine learning, CRISPR, blockchain, etc). For Molvig, emergent technologies can be pithily described as those technologies that are about to go mainstream, that many people think are likely to be of great significance, but no one is completely certain when, for whom, how, or really even if, this will happen.

For VR then, in an academic setting, these questions look like this: Which fields is VR best suited for? Up to that point, it was reasonably common in computer science and psychology, and relatively rare elsewhere. How might VR be integrated into the teaching and research of other fields? How similar or dissimilar are the needs and challenges of these different disciplines pedagogical and research contexts?

Perhaps most importantly, how do we answer these questions? Our primary pedagogical approach crystallized around two fundamental questions:

  1. How can virtual reality inform the teaching and research of discipline X?
  2. How can discipline X inform the development of virtual reality experiences?

Our efforts to answer these questions led to the core feature that has defined our Virtual Reality Design course since its inception: interdisciplinarity. Rather than decide for whom VR is most relevant, we attempted to test it out as broadly as possible, in collaboration with as many scholars as possible.

Our course is co-taught by a computer scientist and a humanist. Furthermore, we invite faculty from across campus to serve as “clients,” each with a real-world, disciplinary specific problem toward which virtual reality may be applicable. While Molvig and Bodenheimer focused on both questions, our faculty mentors focused on question 1: is VR surgery simulation an effective tool? Can interactive, immersive 3D museums provide users new forms of engagement with cultural artifacts? How can VR and photogrammetry impact the availability of remote archeological sites? We will discuss select projects below, but as of our third offering of this course, we have had twenty-one different faculty serve as clients representing twelve different departments or schools, ranging from art history to pediatrics and chemistry to education. A full list of the twenty-four unique projects may be found in Appendix 1.

At the time of course planning, Vanderbilt began a program of University Courses, encouraging co-taught, cross disciplinary teaching experiments, incentivizing each with a small budget, which allowed us to purchase the hardware necessary to offer the course. One of our stated outcomes was to increase access to VR hardware, and we have intentionally housed the equipment purchased throughout campus. Currently, most available VR hardware available for campus use is the product of this course. Over time, purchases from our course have established 10 VR workstations across three different campus locations (Digital Humanities Center, The Wond’ry Innovation Center, and the School of Engineering Computer Lab). Our standard set up has been the Oculus Rift S paired with desktop PCs with minimum specs of 16GB RAM and 1080GTX GPUs.

As the design of the joint, team-taught and highly interdisciplinary course was envisioned, several course design questions presented themselves. In our first iteration of the course, a condensed and more accessible version of the computer science virtual reality class was lectured on. Thus Bodenheimer, the computer science instructor, lectured on most of the same topics he had lectured on but at a more general level, and focused on how the concepts were implemented in Unity, rather than from a more theoretical perspective that was present in the prior offering. Likewise, Molvig brought with him several tools of his discipline, a set of shared readings (such as the novel Ready Player One (Cline 2012)) and a response essay to the moral and social implications of VR. The class was even separated for two lectures, allowing Bodenheimer to lecture in more detail on C#, and Molvig to offer strategies on how to avoid C# entirely within Unity.

Subsequent offerings of the course, however, allowed us to abandon most of this structure, and to significantly revise the format. Our experience with how the projects and student teams worked and struggled led us to re-evaluate the format of the course. Best practices in teaching and learning recommend active, collaborative learning where students learn from their peers (Kuh et al. 2006). Thus, we adopted a structured format more conducive to teamwork, based on Agile (Pope-Ruark 2017). Agile is a framework and set of practices originally created for software development but which has much wider applicability today. It can be implemented as a structure in the classroom with a set of openly available tools that allow students to articulate, manage, and visualize a set of goals for a particular purpose, in our case, the creation of a virtual experience tailored to their clients specific research. The challenge for us, as instructors, was to develop methods to instrument properly the Agile methods so that the groups in our class can be evaluated on their use of them, and get feedback on them so that they can improve their practices. This challenge is ongoing. Agile methods are thus used in our class to help teams accomplish their collaborative goals and teach them teamwork practices.

Course Structure

We presume no prior experience with VR, the Unity3D engine, or C# for either the CS or non-CS students. Therefore the first third of the course is mainly focused on introducing those topics, primarily through lecture, demonstration, and a series of cumulative “daily challenges.” By the end of this first section of the course, all students are familiar with the common tools and practices, and capable of creating VR environments upon which they can act directly through the physics engine as well as in a predetermined, or scripted, manner. During the second third of the course, students begin working together on their group projects in earnest, while continuing to develop their skills through continued individual challenges, which culminate in an individual project due at the section’s end. For the second and third sections of the course, all group work incorporates aspects of the Agile method described above, with weekly in-class group standups, and a graded, bi-weekly sprint review, conducted before the entire class. The final section of the course is devoted entirely to the completion of the final group project, which culminates in an open “demo day” held during final examinations, which has proven quite popular.

Three-fifths of our students are upper level computer science students fulfilling a “project course” major requirement, while two-fifths of our students can be from any major except computer science. Each project team is composed of roughly five students with a similar overall ratio, and we tend to have about 50 students per offering. This distribution and size are enforced at registration because of the popularity of the CS major and demand for project courses in it. The typical CS student’s experience will involve at least three semesters of programming in Java and C++, but usually no knowledge of computer graphics or C#, the programming language used by Unity, our virtual reality platform. The non-CS students’ experience is more varied, but currently does not typically involve any coding experience. To construct the teams, we solicit bids from the students for their “top three” projects and “who they would like to work with.” The instructors then attempt to match students and teams so that everyone gets something that they want.

It is a fundamental assertion of this course that all members of a team so constructed can contribute meaningfully and substantially to the project. As it is perhaps obvious what the CS students contribute, it is important to understand what the non-CS students contribute. First, Unity is a sophisticated development platform that is quite usable, and, as mentioned, we spend significant course time teaching the class to use it. There is nothing to prevent someone from learning to code in C# using Unity. However, not everyone taking our class wants to be a coder, but they are interested in technology and using technical tools. Everyone can build models and design scenes in Unity. Also, these projects must be robust. Testing that incremental progress works and is integrated well into the whole project is key not only to the project’s success as a product, but also to the team’s grade. We also require that the teams produce documentation about their progress, and interact with their faculty mentor about design goals. These outward-facing aspects of the project are key to the project’s success and often done by the non-CS students. Each project also typically requires unique coding, and in our experience the best projects are one in which the students specialize into roles, as each project typically requires a significant amount of work. The Agile framework is key here, as it provides a structure for the roles and a way of tracking progress in each of them.

Since each project is varied, setting appropriate targets and evaluating progress at each review is one of the most significant ongoing challenges faced by the instructors.

Projects

A full list of the twenty-four projects may be found in Appendix 1.

Below are short descriptions and video walkthroughs of four distinctive projects that capture the depth, breadth, and originality fostered by our emphasis on interdisciplinarity in all aspects of the course design and teaching.

Example Project: Protein Modeling

The motivation for this project, mentored by Chemistry Professor Jens Meiler, came from a problem common to structural chemistry: the inherent difficulty of visualizing 3D objects. For this prototype, we aimed to model how simple proteins and molecules composed of a few tens of atoms interact and “fit” together. In drug design and discovery, this issue is of critical importance and can require significant amounts of computation (Allison et al. 2014). These interactions are often dominated by short-range van der Waals forces, although determining the correct configuration for the proteins to bind is challenging. This project illustrated that difficulty by letting people explore binding proteins together. Two proteins were given in an immersive environment that were graspable, and users attempted to fit them together. As they fit together, a score showing how well they fit was displayed. This score was computed based on an energy function incorporating Van der Waals attractive and repulsive potentials. The goal was to get the minimum score possible. The proteins and the energy equation were provided by the project mentor, although the students implemented a Van der Waals simulator within Unity for this project. Figures 1 and 2 show examples from the immersive virtual environment. The critical features of this project worth noting are that the molecules are three-dimensional structures that are asymmetric. Viewing them with proper depth perception is necessary to get an idea of their true shape. It would be difficult to recreate this simulation with the same effectiveness using desktop displays and interactions.

While issues of efficiency and effectiveness in chemical pedagogy drove our mentor’s interest, the student creators and demo day users were drawn to this project for its elements of science communication and gamification. By providing a running “high score” and providing a timed element, users were motivated to interact with the objects and experience far longer than with a 2D or static 3D visualization. One student member of this group did possess subject matter familiarity which helped incorporate the energy function into the experience.

Figure 1. Two proteins shown within the simulation. The larger protein on the left is the target protein to which the smaller protein (right) should be properly fit. A menu containing the score is shown past the proteins. Proteins may be grabbed, moved, and rotated using the virtual reality controllers. Embedded video: Figure 1. Two proteins shown within the simulation. The larger protein on the left is the target protein to which the smaller protein (right) should be properly fit. A menu containing the score is shown past the proteins. Proteins may be grabbed, moved, and rotated using the virtual reality controllers.

Example Project: Vectors of Textual Movement in Medieval Cypress

Professor of French Lynn Ramey served as the mentor for this project. Unlike most other mentors, Prof. Ramey had a long history of using Unity3D and game technologies in both her research and teaching. Her goal in working with us was to recreate an existing prototype in virtual reality, and determine the added values of visual immersion and hand tracked interactivity. This project created a game that simulates how stories might change during transmission and retelling (Amer et al. 2018; Ramey et al. 2019). The crusader Kingdom of Cyprus served as a waypoint between East and West during the years 1192 to 1489. This game focuses on the early period and looks at how elements of stories from The Thousand and One Nights might have morphed and changed to please sensibilities and tastes of different audiences. In the game, the user tells stories to agents within the game, ideally gaining storytelling experience and learning the individual preferences of the agents. After gaining enough experience, the user can gain entry to the King’s palace and tell a story to the King, with the goal of impressing the King. During the game play, the user must journey through the Kingdom of Cyrus to find agents to tell stories to.

This project was very successful at showcasing the advantages of an interdisciplinary approach. Perhaps the project closest to a traditional video game, faculty and students both were constantly reminded of the interplay between technical and creative decisions. However, this was not simply an “adaption” of a finished cultural work into a new medium, but rather an active exploration of an open humanities research project asking how, why, when, and for whom are stories told. No student member of this group majored in the mentor’s discipline.

This project is ongoing, and more information can be found here: https://medievalstorytelling.org.

A video walkthrough of the game can be seen below.

Figure 2. Video walk-through of gameplay. Embedded video: Fig 2. Video walk-through of medieval storytelling project gameplay. Video shows gameplay in main screen, with small inset filming user in VR headset. Gameplay shows the goal and user interface by which players tell stories and explore medieval village. Scenes include a market, a castle, and a village environment.

Example Project: Interactive Geometry for K–8 Mathematical Visualization

In this project, Corey Brady, Professor of Education, challenged our students to take full advantage of the physical presence offered by virtual environments, and build an interactive space where children can directly experience “mathematical dimensionality.” Inspired by recent research (Kobiela et al. 2019; Brady et al. 2019) examining physical geometrical creation in two dimensions (think paint, brushes and squeegees), the students created a brightly lit and colored virtual room, where the user is initially presented with a single point in space. Via user input, the point can be stretched into a line, the line into a plane, and the plane into a solid (rectangles, cylinders, and prisms). While doing so, bar graph visualizations of length, width, height, surface area, and volume are updated in real-time while the user increases or decreases the object along its various axes.

Virtual Reality as an education tool has proven very popular, both amongst our students and in industry. No student member of this group specialized in education, but all members had of course first hand experience learning these concepts themselves as children. The opportunity to reimagine a nearly universal learning process was a significant draw for this project. After this course offering, Brady and Molvig have begun a collaboration to expand its utility.

A video demonstration of the project can be seen below.

Figure 3. User manipulates the x, y, and z axes of a rectangle. Real-time calculations of surface area and volume are shown in the background. Embedded video: Figure 3. Video demonstration of geometry visualization project gameplay. User manipulates the x, y, and z axes of a various shapes, including regular polygons and conic sections. Real-time calculations of surface area and volume are shown in the background.

Example Project: Re-digitizing Stereograms

For this project, Molvig led a team to bring nineteenth-century stereographic images into 21st century technology. Invented by Charles Wheatstone in 1838 and later improved by David Brewster, stereograms are nearly identical paired photographs that when viewed through a binocular display, a single “3D image” [1] was perceived by the viewer, often with an effect of striking realism. For this reason, stereoscopy is often referred to as “Victorian VR.” Hundreds of thousands of scanned digitized stereo-pair photos exist in archives and online collections, however it is currently extremely difficult to view these as intended in stereoscopic 3D. Molvig’s goal was to create a generalizable stereogram viewer: capable of bringing stereopair images from remote archives for viewing within a modern VR headset.

Student interest quickly coalesced around two sets of remarkable stereoscopic anatomical atlases, the Edinburgh Stereoscopic Atlas of Anatomy (1905) and Bassett Collection of Stereoscopic Images of Human Anatomy from the Stanford Medical Library. Driven by student interest, the 2019 project branched into a VR alternative to wetlab or flat 2D medical anatomy imagery. This project remains ongoing, as is Molvig’s original generalized stereo viewer, which now includes a machine learning based algorithm to automated the import and segmentation of any stereopair photograph.

Two demonstrations of the stereoview player are below, the first for medical anatomy images, the second are stereophotos taken during the American Civil War. All images appear in stereoscopic depth when viewed in the headset.

Figure 4. Demonstration of anatomy stereoscopic viewer. Images from the Bassett Collection of Stereoscopic Images of Human Anatomy, Stanford Medical Library. Embedded video: Figure 4. Video demonstration of medical anatomy stereoscopic viewer project gameplay. User selects and relocates various stereoscopic images of cranial anatomy. Images from the Bassett Collection of Stereoscopic Images of Human Anatomy, Stanford Medical Library.
Figure 5. Demonstration of Civil War stereoviews. Images from the Robert N. Dennis collection of stereoscopic views, New York Public Library Digital Collection. Embedded video: Figure 5. Video demonstration of Civil War stereoview project gameplay. User selects and and relocated various stereoscopic images taken during the American Civil War. Images depict scenes from battlefields, army encampments, and war material preparations. Images from the Robert N. Dennis collection of stereoscopic views, New York Public Library Digital Collection.

Challenges

This course has numerous challenges, both inside and outside of the classroom, and we have by no means solved them all.

Institutional

Securing support for co-teaching is not always easy. We began offering this course under a Provost level initiative to encourage ambitious teaching collaborations across disciplines. This initiative made it straightforward to count co-teaching efforts with our Deans, and provided some financial support for the needed hardware purchases. However, that initiative was for three course offerings, which we have now completed. Moving forward, we will need to negotiate our course with our Deans.

We rely heavily on invested Faculty Mentors to provide the best subject matter expertise. So far we have had no trouble finding volunteers, and the growing community of VR engaged faculty has been one of the greatest personal benefits, but as VR becomes less novel, we may experience a falloff in interest.

Interdisciplinarity

This is both the most rewarding and most challenging aspect of this course. Securing student buy-in on the value of interdisciplinary teamwork is our most consistent struggle. In particular, these issues arise around the uneven distribution of C# experience, and perceived notions of what type of work is “real” or “hard.” To mitigate these issues, we devote significant time during the first month of the course exposing everyone to all aspects of VR project development (technical and non-technical), and require the adoption of “roles” within each project to make responsibilities clear and workload distributed.

Cost

Virtual reality is a rapidly evolving field, with frequent hardware updates and changing requirements. We will need to secure new funding to significantly expand or update our current equipment.

Conclusions and Lessons Learned

Virtual reality technology is more accessible than ever, but it is not as accessible as one might wish in a pedagogical setting. It is difficult to create even moderately rich and sophisticated environments, without the development expertise gleaned through exposure to the computer science curriculum. A problem thus arises on two fronts. First, exposure to the computer science curriculum at the depth currently required to develop compelling virtual reality applications should ideally not be required of everyone. Unfortunately, the state of the art of our tools currently makes this necessary. Second, those who study computer science and virtual reality focus on building the tools and technology of virtual reality, the theories and algorithms integral to virtual reality, and the integration of these into effective virtual reality systems. Our class represents a compromise solution to the accessibility problem by changing the focus away from development of tools and technology toward collaboration and teamwork in service of building an application.

Our class is an introduction to virtual reality in the sense that students see the capability of modern commodity-level virtual reality equipment, software, and these limitations. They leave the class understanding what types of virtual worlds are easy to create, and what types of worlds are difficult to create. From the perspective of digital humanities, our course is a leveraged introduction to technology at the forefront of application to the humanities. Students are exposed to a humanities-centered approach to this technology through interaction with their project mentors.

In terms of the material that we, the instructors, focus most on in class, our class is about teamwork and problem-solving with people one has not chosen to work with. We present this latter skill as one essential to a college education, whether it comes from practical reasons, e.g., that is what students will be faced with in the workforce (Lingard & Barkataki 2013), or from theoretical perspectives on best ways to learn (Vygotsky 1978). The interdisciplinarity that is a core feature of the course is presented as a fact of the modern workforce. Successful interdisciplinary teams are able to communicate and coordinate effectively with one another, and we emphasize frameworks that allow these things to happen.

Within the broader Vanderbilt curriculum, the course satisfies different curricular requirements. For CS students, the course satisfies a requirement that they participate in a group design experience as part of their major requirements. The interdisciplinary nature of the group is not a major requirement, but is viewed as an advantage, since it is likely that most CS majors will be part of interdisciplinary teams during their future careers. For non-CS students, the course currently satisfies the requirements of the Communication of Science and Technology major and minor.[2]

Over the three iterations of this course, we have learned that team teaching an interdisciplinary project course is not trivial. In particular, it requires more effort than each professor lecturing on their own specialty, and expecting effective learning to emerge from the two different streams. That expectation was closer to what we did in the first offering of this course, where we quickly perceived that this practice was not the most engaging format for the students, nor was it the most effective pedagogy for what we wanted to accomplish. The essence of the course is on creating teams to use mostly accessible technology to create engaging virtual worlds. We have reorganized our lecture and pedagogical practices to support this core. In doing this, each of us brings to the class our own knowledge and expertise on how best to accomplish that goal, and thus the students experience something closer to two views on the same problem. While we are iteratively refining this approach, we believe it is more successful.

Agile methods (Pope-Ruark 2017) have become an essential part of our course. They allow us to better judge the progress of the projects and determine where bottlenecks are occurring more quickly. They incentivize students to work consistently on the project over the course of the semester rather than trying to build everything at the end in a mad rush of effort. By requiring students to mark their progress on burn down charts, the students have a better visualization of the task remaining to be accomplished. Project boards associated with Agile can provide insight into the relative distribution of work that is occurring in the group, ideally allowing us to influence group dynamics before serious tensions arise.

This latter effort is a work in progress, however. A limitation of the course as it currently exists is that we need to do a better job evaluating teams (Hughes & Jones 2011). Currently our student evaluations rely too heavily on the final outcome of the project and not enough on the effectiveness of the teamwork within the team. Evaluating teamwork, however, has seemed cumbersome, and the best way to give meaningful feedback to improve teamwork practices is something we are still exploring. If we improved this practice, we could give students more refined feedback throughout the semester on their individual and group performance, and use that as a springboard to teach better team practices. Better team practices would likely result in increased quality of the final projects.

Notes

[1] These images are not truly three dimensional, as they cannot be rotated or peered behind. Rather two images are created precisely to fool the brain into adding a perception of depth into a single combined image.
[2] https://as.vanderbilt.edu/cst/. There is currently no digital humanities major or minor at Vanderbilt.

References

Allison, Brittany, Steven Combs, Sam DeLuca, Gordon Lemmon, Laura Mizoue, and Jens Meiler. 2014. “Computational Design of Protein–Small Molecule Interfaces.” Journal of Structural Biology 185, no. 2: 193–202.

Amer, Sahar, and Lynn Ramey. 2018. “Teaching the Global Middle Ages with Technology.” Parergon: Journal of the Australian and New Zealand Association for Medieval and Early Modern Studies 35: 179–91.

Brady, Corey, and Richard Lehrer. 2020. “Sweeping Area Across Physical and Virtual Environments.“ Digital Experiences in Mathematics Education: 1–33. https://link.springer.com/article/10.1007/s40751-020-00076-2.

Cline, Ernest. 2012. Ready Player One. New York: Broadway Books.

Hughes, Richard L., and Steven K. Jones. 2011. “Developing and assessing college student teamwork skills.“ New Directions for Institutional Research 149: 53–64.

Kobiela, Marta, and Richard Lehrer. 2019. “Supporting Dynamic Conceptions of Area and its Measure.” Mathematical Thinking and Learning: 1–29.

Kozlowski, Steve W.J., and Daniel R. Ilgen. 2006. “Enhancing the Effectiveness of Work Groups and Teams.” Psychological Science in the Public Interest 7, no.3: 77–124.

Kuh, George D., Jillian Kinzie, Jennifer A. Buckley, Brian K. Bridges, and John C. Hayek. 2006. What Matters to Student Success: A Review of the Literature. Vol. 8. Washington, DC: National Postsecondary Education Cooperative.

LaValle, Steve 2017. Virtual Reality. Cambridge, UK: Cambridge University Press.

Lingard, Robert, and Shan Barkataki 2011. “Teaching Teamwork in Engineering and Computer Science.” 2011 Frontiers in Education Conference. Institute of Electrical and Electronics Engineers.

Pope-Ruark, Rebecca. 2017. Agile Faculty: Practical Strategies for Managing Research, Service, and Teaching. Chicago: University of Chicago Press.

Ramey, Lynn, David Neville, Sahar Amer, et al. 2019. “Revisioning the Global Middle Ages: Immersive Environments for Teaching Medieval Languages and Culture.” Digital Philology 8: 86–104.

Takala, Tuukka M., Lauri Malmi, Roberto Pugliese, and Tapio Takala. 2016. “Empowering students to create better virtual reality applications: A longitudinal study of a VR capstone course.” Informatics in Education 15, no. 2: 287–317.

Zimmerman, Guy W., and Dena E. Eber. 2001. “When worlds collide!: an interdisciplinary course in virtual-reality art.” ACM SIGCSE Bulletin 33, no. 1.

Appendix 1: Complete Project List

Project Title (Mentor, Field, Year(s))

  1. Aristotelian Physics Simulation (Molvig, History of Science, 2017, 2018).
  2. Virtual Excavation (Wernke, Archeology, 2017, 2018).
  3. Aech’s Basement: scene from Ready Player One (Clayton, English, 2017).
  4. Singing with Avatar (Reiser, Psychology, 2017).
  5. Visualizing Breathing: interactive biometric data (Birdee, Medicine, 2017).
  6. Memory Palace (Kunda, Computer Science, 2017).
  7. Centennial Park (Lee, Art History, 2017).
  8. Stereograms (Peters, Computer Science, 2017).
  9. Medieval Storytelling (Ramey, French, 2017, 2018, 2019).
  10. VR locomotion (Bodenheimer, Computer Science, 2017).
  11. 3D chemistry (Meiler, Chemistry, 2018).
  12. Data Visualization (Berger, Computer Science, 2018).
  13. Adversarial Maze (Narasimham and Bodenheimer, Computer Science, 2018).
  14. Operating Room Tool Assembly (Schoenecker, Medicine, 2018).
  15. Autism Spectrum Disorder: table building simulation (Sarkar, Mechanical Engineering, 2019).
  16. Brain Flow Visualization (Oguz, Computer Science, 2019).
  17. Interactive Geometry (Brady, Learning Sciences, 2019).
  18. Jekyll and Hyde (Clayton, English, 2019).
  19. fMRI Brain Activation (Chang, Computer Science, 2019).
  20. Virtual Museum (Robinson, Art History, 2019).
  21. Peripersonal Space (Bodenheimer, Computer Science, 2019).
  22. Solar System Simulation (Weintraub, Astronomy, 2019).
  23. Accessing Stereograms (Molvig, History, 2019).

About the Authors

Ole Molvig is an assistant professor in the Department of History and the Program in Communication of Science and Technology. He explores the interactions among science, technology, and culture from 16th-century cosmology to modern emergent technologies like virtual reality or artificial intelligence. He received his Ph.D. in the History of Science from Princeton University.

Bobby Bodenheimer is a professor in the Department of Electrical Engineering and Computer Science at Vanderbilt University. He also holds an appointment in the Department of Psychology and Human Development. His research examines virtual and augmented reality, specifically how people act, perceive, locomote, and navigate in virtual and augmented environments. He is the recipient of an NSF CAREER award and received his Ph.D. from the California Institute of Technology.

Screenshot of Gallatin ePortfolio template, displaying the main navigational elements and the homepage welcome message.
0

ePortfolios and Individualized, Interdisciplinary Learning: A Case Study

Abstract

Individualized, interdisciplinary degree programs carry a unique set of challenges and opportunities that can be addressed by ePortfolios. This is especially true for New York University’s (NYU) Gallatin School of Individualized Study, where students must construct their own academic concentrations while taking courses in most of the seventeen schools that comprise the University. In this article, we describe an ongoing project to explore the use of ePortfolios as a means to create coherence for students across courses and semesters, and to help them articulate an intellectual and professional agenda through synthesis and reflection. The project spans three distinct iterations of ePortfolios, and describes how lessons learned from two of the previous iterations helped guide faculty and staff in the development and implementation of a new ePortfolio template, which is currently being piloted. We explore how an overly wrought first iteration led to an excessively focused second version, and finally, a third iteration, that may be just right.

Introduction: The Origins of a Gallatin ePortfolio

The Gallatin School of Individualized Study at New York University (Gallatin) offers a Bachelor of Arts and a Master of Arts in individualized study. The ePortfolio project focuses on the BA program. Students at Gallatin develop their own programs of study by combining Gallatin’s core curriculum of small, interdisciplinary seminars and workshops with courses in other NYU schools. Additionally, students pursue independent studies (one­-on­-one projects with faculty), tutorials (small group projects), private lessons, and internships. This course of study culminates in a final oral exam, called the colloquium, in which students demonstrate their knowledge about a select number of significant texts.

With just over 1,600 undergraduate students and approximately 150 graduate students, Gallatin is a relatively small school housed within a large research university. Being an individualized study major in a small school that is part of a very large university, on a distributed urban and global campus, can be an isolating experience. Because of this, Gallatin has used active, focused faculty advising as a cornerstone of its curriculum from the very first formative years as a program in 1972, and then as a division in 1976. But in 1976, Gallatin had only 200 students (London 1992, 7). By 2008, with a much larger student body, there was agreement among faculty members that students could benefit from a platform that encouraged reflection and collaboration.

This paper outlines three distinct ePortfolio platforms the school developed in an attempt to facilitate this student need for reflection and collaboration. The first was a shared, multi­-university initiative to build out the promising Sakai OAE (Open Academic Environment) into an academic­-social-networking system with ePortfolios as a main component. The second was based entirely on Google Drive, and centered around the collection of course assets. And the final, still ongoing, platform is built around WordPress, which attempts to account for the limitations of the the first two.

During the Fall of 2009, several factors led to the consideration of an ePortfolio for Gallatin students: social media; advancements in ePortfolio and learning management system (LMS) software; digitally native content; and the expansion of the arts and experiential learning at Gallatin. Moreover, many students were coming upon their culminating experience, the colloquium, underprepared, specifically in the integration of coursework spanning their entire academic career. Students, now accustomed to platforms like Facebook and Google Docs, were wondering why there was not an academic corollary.

During a focus group with students concerning the enhancement of the school’s LMS, several ePortfolio-­related themes emerged. Where students used to be satisfied focusing on their individual concentrations and learning goals, they were now interested in community. Several students at the Fall 2009 LMS focus group asked for a way to find other students with similar academic interests. Additionally, participants mentioned how they would like to share their academic work across courses, in ways that would surface meaningful connections between students. These students’ comments were aligned with the research on ePortfolios. Bryant and Chittum (2013, 189­197) note that successful ePortfolios enable students to share and collaborate on work spanning their entire program. This finding is consistent with trends in ePortfolio use at the time, where less course-­ and program­-based, and more collaborative ePortfolios were gaining in popularity (Brown, Chen, and Gordon 2012, 129-­138).

This focus group conversation became one about effective ePortfolios. The students recognized the need for a tool to capture, synthesize, and share their academic careers, a way to “utilize Facebook[-like]…prefab micro-­sites…So that people could upload different documents” (personal communication). Several students advocated for a platform that encourages self­-assessment and peer assessment, foundational elements of good ePortfolio design (Wade, Abrami, and Sclater 2005, under “Student Self­-regulation”).

The author, Likos, in conversation with the faculty, was also coming to a similar conclusion: a tool was needed that could help scaffold the development of the individualized concentration; encourage the synthesis of experiential, performative and academic learning; and allow for the communication and articulation of the students’ work. Hayward et al. explain how ePortfolios can help achieve just these goals, emphasizing the tool’s ability to help integrate different modes of learning (2008, 140–­159). Additionally, the ePortfolio is specifically valuable in interdisciplinary studies. Field and Stowe explain that the “the longitudinal nature of the process,” which provides explication of an entire learning journey, “can be used effectively to validate the interdisciplinary process and to communicate the process to internal, and external audiences” (2002, 268).

As a result of our student focus group, faculty discussion, and research on ePortfolios, a specific articulation of the requirements for a Gallatin ePortfolio platform emerged:

  1. The system must allow for text­-based and digitally native content.
  2. Assets must be flexibly shareable—to students in a course, the school, the University, and the outside world.
  3. Assets must be taggable in a manner that encourages searching, browsing, filtering, and sorting.
  4. The ePortfolio must evolve from a student’s first year through their life after college.
  5. The platform must allow for the creation of attractive public-facing websites.

A landscape survey of existing software at the time found that none could satisfy all of these criteria. Most ePortfolio platforms were still focused on assessment (Clark and Eynon 2009, 18­–23), which was not the core requirement of a Gallatin ePortfolio. With this in mind, we broadened our search beyond specific ePortfolio software to platforms that could act more as a development toolkit. This led to Gallatin’s, and later NYU’s, significant engagement with Sakai.

Sakai OAE and ATLAS: A Grand Vision Leads to Loss of Focus

Just as the benefits of an a ePortfolio system were becoming clear to the Gallatin community, so too were these benefits being recognized by another department at the University, the Liberal Studies Program. Confronted with similar requirements, an ePortfolio project was initiated in 2008 with the help of a National Endowment for the Humanities (NEH) Digital Humanities Start-­Up Grant (Apert 2011). Like Gallatin, the Liberal Studies Program was aiming for a system that would support content authoring, management and tagging, private­ and public-facing ePortfolios, and academic networking. Gallatin was thus a natural partner, and joined the initiative in 2008. By 2009, Liberal Studies and Gallatin were joined by 8 additional NYU entities.[1]

With this infusion of interest and capital, a new ambition grew, and a new, more robust platform was needed to meet these ambitions. Liberal Studies, already using Sakai CLE (Collaboration and Learning Environment) for the first iteration of its ePortfolio, recognized the potential of the then nascent Sakai OAE (Open Academic Environment). The promise of OAE was a user­-, group­-, and content-­centered system. As Apert explains, Sakai OAE “uses the…concept of groups to replace the more rigid structure of sites in traditional learning management systems (LMS)….In Sakai OAE…tools are ‘widgetized,’ meaning they exist as free-­floating modules that can be pulled into any page” (2011). This is in contrast to Sakai CLE, and most LMSs at the time, which were built with the course at the core.

After several months of collaboration, a working group of faculty and staff members representing the ten schools and departments committed to this project were so enthusiastic about the promise of a user- ­and content-­centered academic networking platform, that by mid­-2010 NYU had become the most significant partner in a multi-university alliance to build the next generation LMS (Hill 2012). Along with Cambridge University, the University of California, Berkeley, Indiana University, Georgia State University, and Charles Sturt University, NYU shared a seat on the Sakai OAE steering committee, and NYU’s Chief Digital Officer, David Ackerman, was appointed to the position of Sakai Board Chair.

But by the end of 2010, this was already something very different than the ePortfolio project on which Gallatin had first partnered with NYU’s Liberal Studies Program. The Gallatin ePortfolio had very specific requirements around content and sharing, which though part of the roadmap for Sakai 3, would now have to share space with all of the traditional functions of an LMS. With Sakai CLE representing five percent of the higher­-education LMS market at this time, legacy tool support and development was no small matter (Green 2013, 23). As a member of the NYU Sakai 3 working group, Likos had to collaborate with representatives from nine other schools and departments at NYU to set priorities that would then compete with those from the six other Sakai steering committee member universities. Predictably, this produced a very large set of requirements.

By Spring 2011, nearly two years after the first discussions about ePortfolios for Gallatin students occurred, the first beta iteration of NYU’s version of Sakai 3, ATLAS (Advanced Teaching, Learning, and Scholarship) network, was running. Though our initial plan was to help undergraduates synthesize and share their concentrations, we decided our first pilot would be with graduate students for two reasons. First, this initial iteration of ATLAS had severe performance and feature shortcomings. It simply could not handle more than dozens of users at a time, and many of the features supporting content creation, tagging, and sharing were not yet built. The second reason was that our graduate students were beginning to ask for a simplified platform for finding each other. That is, they were happy to have an enhanced directory of students that could be filtered according to academic interest. Given the limitations of ATLAS, it made more sense to pilot a more condensed feature set to a smaller group of 150 students. While supporting this pilot for graduate students, we continued to push for development of features that would turn this into a true ePortfolio for our BA students.

By Spring 2012, with the 1.1 version of ATLAS released, we were not significantly closer. The platform was now more capable of handling larger numbers of users, the content authoring interface was better, but it was not an ePortfolio. The centrifugal force of multiple schools’ and universities’ competing requirements and features continually pulled at the center until there was barely a center at all. In the end, it was neither a fully functional LMS or an ePortfolio. This, combined with the emergence of Google Apps for Education and the Universities’ adoption of it, and new LMSs like Canvas and D2L, spelled the end for ATLAS and the larger Sakai OAE project. By the Spring of 2012, all of the remaining large university funding partners left the project, and NYU soon followed suit, officially sun­-setting the pilot on January 22, 2013.

In its final iteration, Gallatin’s version of ATLAS included academic profile information for 150 graduate students, as well as a tag cloud (see Figure 1) to help visualize the weight of academic interest areas. It contained no other ePortfolio assets, though technically, it could have. Our assessment of the platform was that it failed in at least some way in each of the five categories of requirements initially laid out. The most successful feature was the academic interest tag cloud, and if extended to content, as originally envisioned, it could have been a valuable way for students to share and collaborate.

Screenshot of Atlas tag cloud for Gallatin MA students, showing the top 20 tags, with Cultural Studies heavily weighted in the center.

Figure 1: ATLAS tag cloud.

There are many lessons to be learned from Gallatin’s Sakai OEA/ATLAS journey, foremost of which is that Gallatin handed over its agency in developing an ePortfolio platform in the hope of being part of something that would be much more. The project grew so large, so quickly, that the competing requirements of multiple universities and schools became increasingly difficult to manage and fund. Another takeaway was that the mass of the “academic social networking” feature set was so great that it pulled almost all the development and pedagogical energy into its gravity well. The promise of a “Facebook for the academy” was so alluring that we shifted too much attention from the core elements of a successful student ePortfolio.

Google Drive: Familiarity without Scalability

It was from this place that a re-conceived ePortfolio platform was born. In the spring of 2013, a reconfigured Gallatin steering committee was assembled to review the failures of the ATLAS project and to recommend a new way forward. One of the first issues we uncovered was that ATLAS privileged technology over good pedagogical design. We hoped the technology would allow for robust connections among students without specific prescriptions, as was the case in other social networks. The idea was that students would upload any assets they thought relevant to their concentrations, and the metadata would do the magic of surfacing the relevant, connected information. This proved to be technically very difficult, and not clear at all to the student participants. Additionally, Gallatin had prescriptions that could and should be applied to ePortfolios:

  • Course documents: syllabi, papers, readings.
  • The booklist and rationale: documents prepared in advance of the colloquium that contain 20 to 25 texts that cover multiple disciplines and historical periods related to the student concentration, and a five­- to eight-­page essay that articulates the central themes that are represented by the booklist.
  • The Intellectual Autobiography and Plan for Concentration (IAPC): a two-­ to three-­page essay, completed at the end of a student’s sophomore year, in which students reflect on their educational progress and describe their areas of interest.
  • Plans of Study: forms filled out every semester outlining the students’ registration plans for the following semester, and how these relate to their individualized course of study.

Starting from these assets, the committee recognized an opportunity to focus the scope of a project that had become so large with ATLAS to a simpler set of requirements. This new conception asked, what is the easiest and most stable system that students can use to store and share their course and concentration documents? Taking this together with the original prerequisites from 2009, and the lessons learned from ATLAS, an updated requirement set asked that:

  1. The system allows for text-­based, as well as multimedia content.
  2. All assets be shareable to faculty, advisers, other students, and the public.
  3. Assets in the ePortfolio be accessible to students after they graduate.
  4. The platform already be built, stable, technically vetted, and inexpensive.

Taking these into account, it was a very easy decision to pilot a new ePortfolio project with Google Drive. NYU’s investment in Google Apps for Education was increasing, and a University­-led ePortfolio landscape survey indicated that Google Drive was a viable ePortfolio alternative for simple projects. Additionally, it was a familiar product, with a support and training structure in place. In terms of storage and performance, we already knew that it could handle thousands of students and assets, and we knew those assets could be securely shared with individuals and groups using existing NYU credentials. Furthermore, there was no direct cost to Gallatin. The platform and the central support was free, and students would keep their Google accounts, including their ePortfolios, after graduation. With the benefits of a Google Drive ePortfolio clear, and the cost to adoption low, it was decided that a new pilot would launch in the Fall of 2013. Gallatin would pre-­populate the following folders and documents in all students’ drives:

  • Courses
    • Syllabi
    • Papers
    • Readings
  • Brainstorming
    • Bibliography (citations of key texts)
    • “Concentration” document (notes from adviser meetings, thoughts on classes, ideas about one’s concentration)
    • Plans of Study (saved copies of the Plan of Study forms)

With both the ATLAS and the Google pilots, the steering committee considered making the ePortfolio mandatory, but both times it was decided that the administrative burden on faculty was too great. With ATLAS, the ePortfolio component was not well defined, and the system not robust enough. The Google Drive ePortfolio was well defined, and the system was robust enough, but if we were going to utilize course registration holds—or use some other constraint—it meant either the faculty advisers or some other academic staff would need to review and approve ePortfolios. It was felt that Gallatin did not at the time have the resources to incent, train, and support the faculty and staff to perform this task well. Instead, beginning in the Spring of 2013, we undertook a marketing and training campaign. This included presentations at faculty meetings, online video demonstrations, and orientation training sessions for students.

The technical administration of the ePortfolios was fairly simple, but not straightforward. Because the University’s implementation of Google Apps could not ingest school and class directory information, there was no way to automate the group creation of the “Gallatin ePortfolio,” or easily generate unique ePortfolio URLs. This all required additional manual work.

In early Fall 2013, the first set of student ePortfolios were provisioned. These included all 269 Gallatin first­-year students. An email from the dean was sent to these students with a link to their ePortfolios and instructions on how to use them. Simultaneously, messaging went out to faculty encouraging them to remind students about the ePortfolio. The same basic structure for the ePortfolios remained in place through the Fall 2014 semester, but by the third semester of the pilot we had added sophomores and juniors.

From the student perspective, the system worked well. Students that chose to create an ePortfolio reported no issues creating and storing content. There was also very little student training required. But by the second semester, the University began to have trouble provisioning the accounts and setting permissions. The Google Apps administrators had to do this with a series of scripts, and there was concern that any change Google made to the product, which was not uncommon, could break the scripts. Additionally, it was at this time that we realized there were little to no options for getting data from the system. Even something as simple as getting a count of how many students were placing content into their ePortfolios was only possible by manually, visually checking each student’s ePortfolio folder. In the end, we used a randomly generated number set to choose a statistically significant sample of ePortfolios to manually check for content. By the final pilot semester, Fall 2014, only 1.9% of students had placed any content into their ePortfolios.

In summation, the Google Drive ePortfolio platform failed in several areas. Most compelling was the modest adoption rate, but the difficulty in extracting metrics from the system, and increasing difficulty provisioning accounts and permissions were also important. For these reasons, it was decided that Fall 2014 would mark the end of this pilot. Though there were technical limitations, it was the adoption rate that had the most impact in our final assessment. In discussions with students and faculty, it became clear that this pilot offered little in the way of incentive or injunction. Their use rate was very low in part because there was no appealing public-­facing aspect of the ePortfolios, but even more significantly because of the way the ePortfolios were presented and taught. It had been decided to market the ePortfolio to students and faculty, instead of train faculty to actively engage with students around the ePortfolio in their courses; we now see that decision as a mistake. These two key issues we hoped to address in the next pilot.

WordPress: Re­-centering on Reflection

Taking into account the lessons learned from our ATLAS and Google Drive experiences, we are now in the midst of our third iteration of ePortfolios at Gallatin, this time using NYU’s WordPress installation, Web Publishing, which launched in August of 2014. Like Google Drive, Web Publishing comes with NYU IT support and training, provides adequate storage for our multimedia needs, is integrated with our user-­authentication system, and is a no-­cost, portable platform. Unlike Google Drive, however, Web Publishing enables us to create a template tailored to the needs of our students, so that we are now able to easily deploy sites as needed. More important than the authentication and storage benefits, however, is the built-­in reflective space Web Publishing offers, as well as the ability to create visually appealing, customizable, public-­facing websites with granular control over visibility. Our hope is that the personalization achieved through reflective blog posts and customization features will give students a strong sense of ownership over their ePortfolios, thereby incentivizing adoption rates.

With a renewed focus on reflection, the committee has decided to diverge from the structure adapted for Google Drive, which functioned primarily as a repository of work. Our new template thus contains areas for four main types of reflective content: the “about me” bio page, the course descriptions and expectations blog, the end-of-semester reflections, and an annotated bibliography (see Figure 2).

Screenshot of Gallatin ePortfolio template, displaying the main navigational elements and the homepage welcome message.

Figure 2: The Gallatin ePortfolio template.

In addition to these pre­-packaged content areas, students are encouraged to customize their ePortfolios in order to document all of their Gallatin­-related experiences, including internships, study-­abroad, and extracurricular activities, thereby creating a comprehensive repository that gives viewers both a general sense of the breadth and scope of a student’s intellectual trajectory, and the ability to drill down into the details of a particular term, course, or activity.

Participating faculty are being asked to integrate several activities into their courses that are designed to both kick­start student engagement with their ePortfolios, and to encourage students to begin thinking metacognitively about themselves as learners. Advisers are participating in the pilot by asking their advisees to see their ePortfolios. We believe that active involvement on the part of faculty and advisers will be a critical component to the success of the program.

On the first day of class, faculty ask their students to write a short bio for the About Me page. Not only is the ability to write a compelling bio a skill that will benefit students personally and professionally, it is also an exercise in narrating selfhood that should always precede engagement with digital identities, of which ePortfolios are a part. Moreover, sharing and discussing bios in a classroom environment promotes the development of learning communities that are so important to students’ mental health and wellness, and so critical to long-­term academic success. Early in the semester, students are also asked to write a blog post containing the course descriptions for each class they take, accompanied by their expectations for these courses. By doing so, students will not only create a chronological record of the courses they take, they will be setting up personal learning goals that will help sustain their focus throughout the semester. These initial reflective posts are then connected to the reflections they are asked to write on the last day of class. In their “end­-of-­semester reflections,” students are asked to compare what they had expected to learn with what they actually learned, and to make a list of key texts from the semester. The blog is a space to assist students in reflecting on their learning as they develop over the course of each term, and to help suggest a direction for the coming term. Such reflections will allow students to document the evolution of their intellectual pathways, to make connections, and to generate questions for future research and for their advisers.

These reflections will act as a pre-­writing activity, providing material for the IAPC, the booklist/rationale, and the colloquium, all of which require students to articulate their research interests and to identify thematic correspondence between the various areas of study. This, ultimately, is at the core of what we are trying to achieve: to help our students connect the dots. As the “school of individualized study,” Gallatin requires its students to design their own curriculum, in conjunction with an adviser. This self-­directed learning model empowers students to actively engage in the development of their own education, and allows them to take a wide variety of courses, both at Gallatin and at other NYU schools (and beyond). But this learning model also comes with unique challenges. Because students are exploring many different subject areas, it is often difficult for them to articulate the connections and/or tensions between them. Milestone requirements, such as the IAPC due at the end of sophomore year, and the booklist/rationale required before the final senior colloquium, have been put in place as scaffolding, preparing students for the kind of scholarly synthesis that will be expected of them during their final oral examination. Yet these milestones are themselves rigorous requirements that will also, we believe, benefit from the kind of sustained reflection built into the design of our ePortfolios. The designated Annotated Bibliography page, for instance, is something students can build up over time, and can eventually become a direct precursor to the booklist and rationale.

Taken as a whole, the design of our ePortfolio template works to engage students in an ongoing reflective process that can best be described as active, inquiry-­based learning. As Wozniak writes, “Reflection connects the components of the inquiry cycle and serves as the catalyst to move to the next level of learning and discovery. Information is transformed to knowledge and fragmented pieces of knowledge are connected through reflection” (2012, 221). Used as an advising tool, Gallatin’s ePortfolio provides a collaborative space in which to make those connections. By incrementally archiving, curating, and reflecting upon their coursework, students will essentially be self-­scaffolding their learning, progressively building toward a stronger understanding of their own concentration. Wozniak also notes that reflection promotes integrative learning, a pedagogical approach in which students apply “multiple areas of knowledge and multiple modes of inquiry” (2012, 210) to real-­world situations: “These learning experiences consider the whole student and foster lifelong learning skills. They engage students in making their own learning connections between their courses, professional career goals, co­-curricular activities, campus involvement, community service, job experiences, and personal interests” (2012, 210). An integrative learning approach that considers the whole student is foundational to the mission at Gallatin, making a reflective ePortfolio system a natural addition to our program.

In order to ensure the successful implementation of an ePortfolio program that would be both meaningful for students and helpful to their advisers, we opted for an incremental, three-­phase roll out plan:

3-Phase Implementation Plan
Phase Phase Title Duration Dates Primary Purpose
1 Targeted Pilot One Semester 12/2015 to 5/2016
  • Assess the usability of the WordPress template
  • Obtain student feedback
2 Extended Pilot Two Years 9/2016 to 5/2018
  • Assess the adoption rate by students and advisors
  • Evaluate the success of the pedagogical goals of the program
3 Gallatin­Wide Implementation Indefinite 9/2018 +
  • Implement a successful school­wide ePortfolio program

We have completed Phase 1, the Targeted Pilot, which included eight students hand­-selected by their advisers. Our initial assessment of the Targeted Pilot is based on attendance, anecdotal feedback, questionnaire results (see Appendix), and completion rates. Although attendance at our group meetings was low, students responded positively to both the platform and the program. Our students had varying degrees of technological skills, yet all of them felt that WordPress was easy to learn and has long­-term value. Participants responded favorably to the template’s design. Most of the students commented that the information architecture was intuitive, and several participants confirmed that the ePortfolio should be a space for highly curated materials, rather than a repository for all content, which may be best suited for Google Drive.

In terms of the ePortfolio program itself, the belief that a school­-wide digital portfolio service would be valuable to Gallatin students was unanimous. Our primary purpose was to equip students with a tool with which to reflect on their progress, map out the next steps in their plan of study, and build towards future milestones. And to that end, the pilot succeeded. Not only did students report that an ePortfolio would have helped them complete specific milestones, they also expressed the belief that communication with their advisers would be improved. The surprising discovery was that students are increasingly expected to include ePortfolios in their application materials for graduate schools, internships, and other professional opportunities. This anecdotal information is confirmed in a study by Fowler (2012), who notes that an ePortfolio provides a better demonstration of student learning and skills than a standard resume because it represents a range of work, contextualized over time, and because it can be customized for multiple audiences. Our students likewise saw an opportunity either to use their Gallatin ePortfolio for such applications, or to become familiar with the process in order to create a separate ePortfolio.

Based on our assessment of the Targeted Pilot, we have entered Phase 2 of our implementation plan, which will run from September 2016 to May 2018. Our Extended Pilot currently includes our entire incoming first­-year cohort, as well as 31 transfer students, for a total of 328 students and 19 faculty. Our ultimate goal is to seamlessly integrate ePortfolios into Gallatin’s curriculum, such that the incoming class of 2016 and all successive cohorts will view their ePortfolios as a dynamic, evolving, and natural component of the individualized and life­-long learning goals at the core of Gallatin’s philosophy.

Conclusion

There have been vast cultural and technological developments since our first discussions about ePortfolios in 2009, including advancements in open­-source technology, broader use of website building platforms, and shifting boundaries between social media and other web-authoring sites. These developments, in conjunction with an increasingly technologically sophisticated and visually literate student population, build an even stronger case for the implementation of ePortfolios at Gallatin. Having learned much over seven years of exploration, experimentation, and investment in ePortfolios, we have refocused our energy on the individualized philosophy at the core of Gallatin, prioritizing user experience over technical sophistication; focused, purposeful design over broad, generalized application; and, most importantly, pedagogy over technology. The emphasis on curation over archive and reflection over assessment promotes the kind of inquiry­-based, integrative learning that is aligned with Gallatin’s mission, and that comprise the most promising pedagogical aspects of ePortfolios. Although early in our third ePortfolio iteration at Gallatin, we are encouraged by the enthusiasm with which our pilot participants received their customizable digital showcases, and hopeful that by the time our incoming class of 2016 becomes our graduating class of 2020, ePortfolios will have become a part of the fabric of Gallatin life.

Notes

[1] The College of Nursing, the Faculty of Arts and Science, NYU Abu Dhabi, NYU Wagner, the NYU School of Medicine, NYU Steinhardt, NYU Information Technology Services, and the NYU Libraries (Apert 2011).

Bibliography

Apert, Lucy. 2011. “The ATLAS Network Pilot: NYU’s Sakai Open Academic Environment Initiative.” NYU Connect: Information Technology at NYU. https://wp.nyu.edu/connect/2011/01/21/the-atlas-network-pilot/.

Brown, Gary, Helen L. Chen, and Aifong Gordon. 2012. “The Annual AAEEBL Survey at Two: Looking Back and Looking Ahead.” International Journal of ePortfolio 2 (2): 129­38. http://theijep.com/pdf/IJEP93.pdf.

Bryant, Lauren H., and Jessica R. Chittum. 2013. “ePortfolio Effectiveness: A(n Ill­fated) Search for Empirical Support.” International Journal of ePortfolio 3 (2): 189­98. http://www.theijep.com/pdf/ijep108.pdf.

Clark, Elizabeth J., and Bret Eynon. 2009. “E­-portfolios at 2.0—Surveying the Field.” Peer Review: Emerging Trends and Key Debates in Undergraduate Education 11 (1): 18­23. http://www.aacu.org/sites/default/files/files/peerreview/Peer_Review_Winter_2009.pdf.

“Fall 2009 NYU Gallatin LMS Focus Group.” 2009. Interview by author.

Field, Michael, and Donald Stowe. 2002. “Transforming Interdisciplinary Teaching and Learning through Assessment.” In Innovations in Interdisciplinary Teaching American Council on Higher Education, edited by Carolyn Haynes, 256­274. Connecticut: Oryx Press.

Fowler, Matthew. 2012. “Developing a Template for Electronic Portfolios in Career and Technical Education.” PhD diss., The University of Nebraska–Lincoln. ProQuest/UMI (3503365).

Hayward, Lorna M., Betsey Blackmer, Alicia Canali, Rosemarie Dimarco, Alicia Russell, Susan Aman, Jessica Rossi, and Lucia Sloane. (2008). “Reflective electronic portfolios: A design process for integrating liberal and professional studies and experiential education.” Journal of Allied Health 37 (3), 140­159.

Hill, Phil. 2012. “Now UC Berkeley and Charles Sturt University Leave Sakai OAE.” e-­Literate. http://mfeldstein.com/now-uc-berkeley-and-charles-sturt-university-leave-sakai-oae/.

London, Herbert I. 1992. “A Gallatin Chronology.” The Gallatin Review 11 (1): 7.

Green, Kenneth C. 2013. “The National Survey of Computing and Information Technology.” http://www.campuscomputing.net/sites/www.campuscomputing.net/files/CampusComputing2013_1.pdf.

Wade, Anne, Philip C. Abrami, and Jennifer Sclater. 2005. “An Electronic Portfolio to Support Learning.” Canadian Journal of Learning and Technology 31 (3). https://www.cjlt.ca/index.php/cjlt/article/view/26489/19671.

Wozniak, Nancy McCoy. 2012. “Enhancing Inquiry, Evidence­-Based Reflection, and Integrative Learning with the Lifelong ePortfolio Process: The Implementation of Integrative ePortfolios at Stony Brook University.” Journal of Educational Technology Systems 41 (3): 209­30. doi:10.2190/ET.41.3.b. EBSCO (ATT 88230618).

Appendix


In response to prompt, “Please check off all areas of the ePortfolio that you worked on,” 83% checked homepage, about me, and courses pages.
In response to a question about how much time students spent on their ePortfolios, 83% indicated 2 to 5 hours.

In response to the question, “Did you feel as though the time spent was useful,” 67% checked “yes.”

In response to the question, “Was it difficult for you to develop your ePortfolio,” 83% checked “no.”

Students elaborate on answers to Q4, citing platform limitations, prior experience with WordPress, and time investment as considerations.

In response to a question about barriers to engagement, 100% said “lack of time,” while “unfamiliarity with WordPress” and lack of interest/motivation were also cited.

In response to a question about how to increase engagement, students cited deadlines, mandates, starting early, and making it more professional.

In response to the question, “Did you use the resources at https://wp.nyu.edu/gallatin­eportfolios/,” 83% indicated “yes.”

In response to the question, “Do you think the portfolio should be mandatory for all students,” 33% said “yes,” 17% said “no,” and 50% said “other.”

Additional comments: other systems for saving work, ePortfolios should be mandatory, and favorable thoughts about the design.

About the Authors

Nick Likos is NYU Gallatin School’s Chief Information Officer. He is responsible for the oversight of technology, operations, and compliance. Likos’ career has spanned fifteen years as a leader in for­-profit and nonprofit management, focusing on the efficient use of educational technologies. Likos’ most recent work has been in the academic social networking sphere, developing strategies and systems for integrating pedagogical and social technologies. His research interests include experiential mediation, interface, actor network theory and boundary theory.

Jenny Kijowski is NYU Gallatin’s Educational Technologist. She is responsible for facilitating the development of pedagogically driven, technology­-enhanced teaching practices in the classroom and beyond. She previously taught English Literature, Creative Writing, and Composition courses at BMCC and Queens College, and received her doctorate in English from the Graduate Center of the City University of New York. Her research examines war, trauma, gender, and technology.

Images are for demo purposes only and are properties of their respective owners. ROMA by ThunderThemes.net

Skip to toolbar